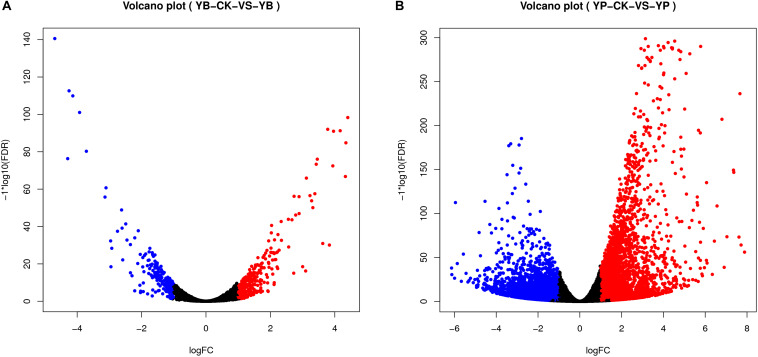
FIGURE 4.
Visualization of differentially expressed genes (DEGs) in the interaction transcriptome (volcano map). DEGs were analyzed using DESeq2 (V1.6.3) in the Bioconductor software package and mapped to volcanoes. Red dots indicate gene up-regulation. Blue dots indicate gene down-regulation. The abscissa represents the fold change in gene expression in different samples. The ordinate represents the statistical significance of the difference in gene expression. (A) Visualization map of DEGs in strain YC0136. YC0136 cells in the YC0136-tobacco co-cultured group were labeled YB. YC0136 cells in the control group were labeled YB-CK. (B) Visualization map of DEGs in tobacco. Tobacco roots from the co-cultured group were labeled YP, and tobacco roots from the control group were labeled YP-CK.

