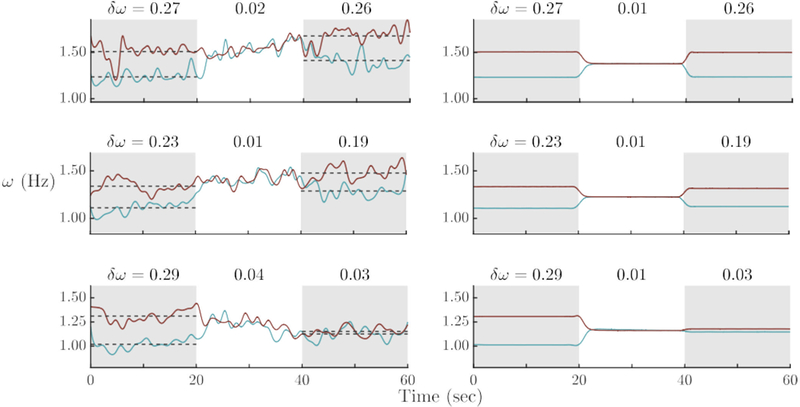
Figure 9.

The role of frequency adaptation (ε) in establishing collective behavior during social interaction and post-interactional frequency differences: Experimental trials (left column) and model simulations (right column) in which the stage after social contact is affected by frequency adaptation, increasing from no change (top row) to some mutual change (middle row) to remaining nearly as frequency–coupled as during visual contact. Model parameters: ε1,2 = 0.02 (top), ε1,2 = 0.07 (middle), ε1,2 = 0.70 (bottom), with A1,2 = −2.00 for all three simulations.
