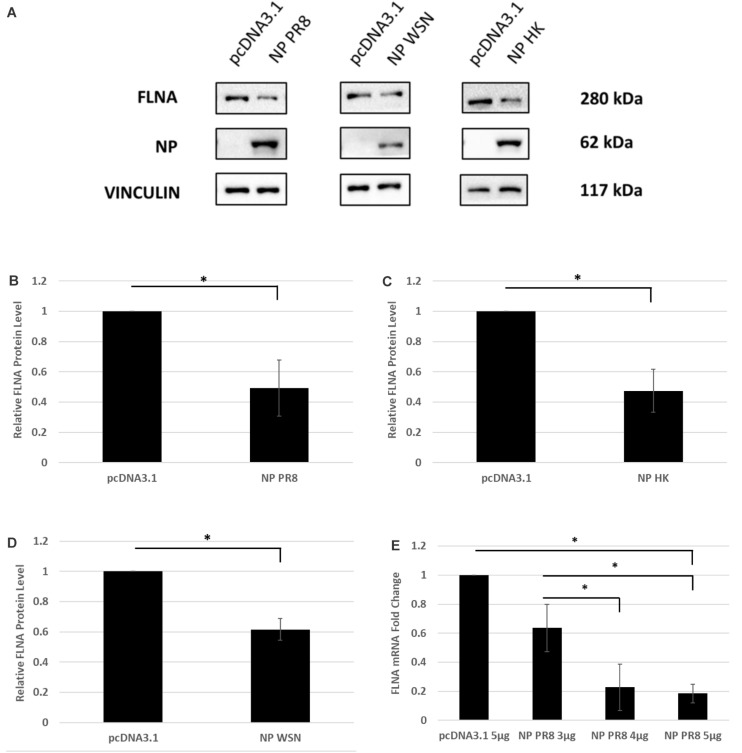
FIGURE 3.
FLNA protein and mRNA levels attenuated in the presence of IAV NP. (A) HEK293 cells were transfected with 5 μg of either the pcDNA3.1 control plasmid or NP plasmid from the PR8, HK, or WSN strain. The cells were harvested with lysis buffer 24 h post-transfection and the purified protein lysate was subjected to SDS-PAGE and Western blot analysis. Blots were developed by ECL for FLNA, vinculin (loading control), and NP. Densitometric analysis was performed for (B) PR8, (C) HK, and (D) WSN transfected samples using the ImageJ software to visualize FLNA protein levels. The data show mean ± S.D. from one representative experiment (n = 3) (see Supplementary Figures 1–3). Statistical significance was determined using Student’s t test (∗p < 0.05). (E) HEK293 cells were transfected with pcDNA3.1 empty control plasmid or NP(PR8) plasmid in a dose-dependent manner. 24 h post-transfection, the cells were harvested, and total RNA was extracted followed by FLNA and GAPDH (loading control) mRNA estimation via qRT-PCR. Results are shown as mean ± S.D. of three independent experiments (n = 9). Statistical significance was determined using one-way ANOVA with post-hoc Tukey test (∗p < 0.05).

