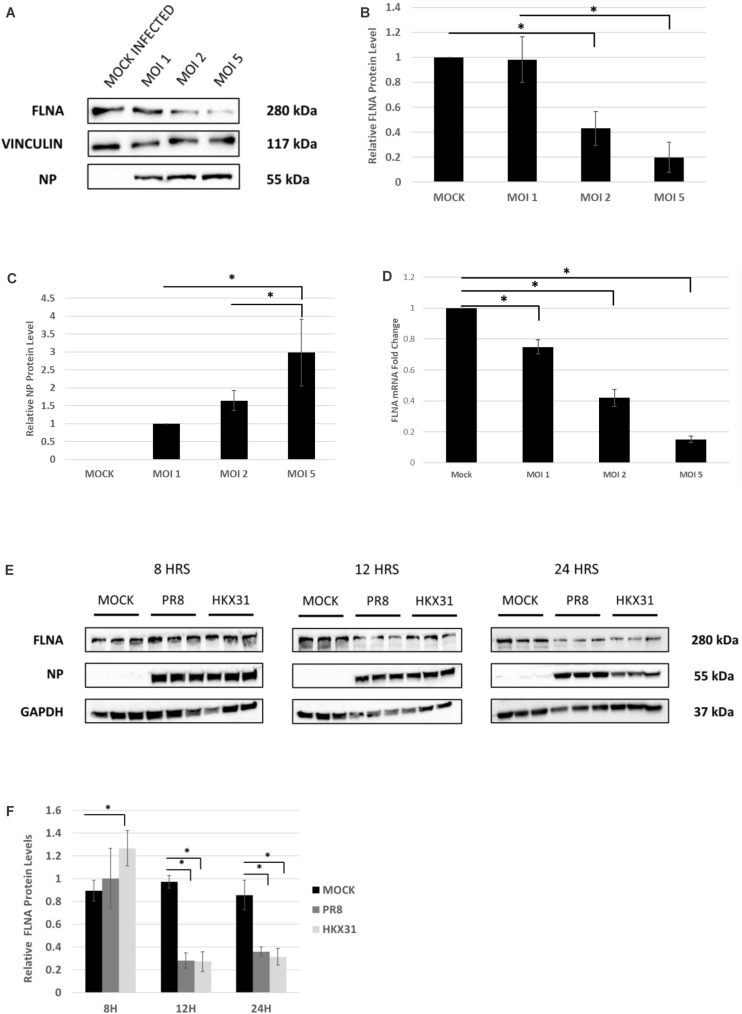
FIGURE 4.
FLNA protein and mRNA levels attenuated in an IAV microenvironment. (A) A549 cells were infected with IAV PR8 in a dose-dependent manner. 24 h.p.i the cells were harvested with RIPA buffer and 30 μg of protein lysate was loaded onto an SDS-PAGE gel followed by Western blotting. Blots were developed by ECL for FLNA, vinculin (loading control), and NP. (B,C) Densitometric analysis was performed for the dose-dependent IAV infected samples using the ImageJ software to visualize FLNA and NP protein levels. The data show mean ± S.D. from one representative experiment (n = 3) (see Supplementary Figure 5). Statistical significance was determined using one-way ANOVA with post-hoc Tukey test (∗p < 0.05). (D) A549 cells were infected with IAV PR8 in a dose-dependent manner. 24 h.p.i the cells were harvested, and total RNA was extracted followed by FLNA and β-actin (loading control) mRNA estimation via qRT-PCR. Results are shown as mean of ±S.D. of three independent experiments (n = 9). Statistical significance was determined using one-way ANOVA with post-hoc Tukey test (∗p < 0.05). (E) A549 cells were infected with IAV PR8 (MOI = 5) and HKX31 (MOI = 1). The cells were harvested in a time-dependent manner with RIPA buffer and 30 μg of protein lysate was loaded onto an SDS-PAGE gel followed by Western blotting. Blots were developed by ECL for FLNA, GAPDH (loading control), and NP. (F) Densitometric analysis was performed for the infected samples harvested in a time-dependent manner using the ImageJ software to visualize FLNA protein levels. The data show mean ± S.D. from one representative experiment (n = 3). Statistical significance was determined using one-way ANOVA with post-hoc Tukey test (∗p < 0.05).

