FIGURE 5.
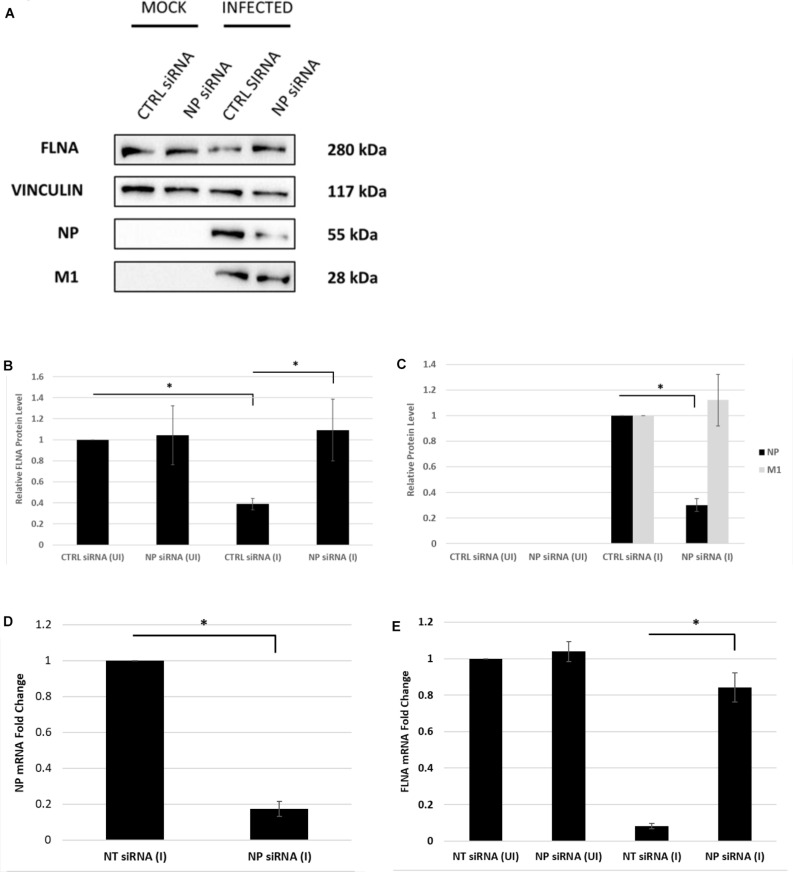
The NP of IAV is essential to attain FLNA attenuation post-IAV infection. (A) A549 cells were transfected with non-targeting control or NP siRNA (100 nM) for 24 h followed by IAV PR8 infection (MOI = 5). 24 h.p.i, the cells were harvested with RIPA buffer and 30 μg of protein lysate was loaded onto an SDS-PAGE gel followed by Western blotting. Blots were developed by ECL for FLNA, NP, M1, and vinculin (loading control). (B,C) Densitometric analysis was performed using the ImageJ software to determine FLNA, M1, and NP relative protein levels. The data show mean ± S.D. from one representative experiment (n = 3) (see Supplementary Figure 6). Statistical significance was determined using one-way ANOVA with post-hoc Tukey test (∗p < 0.05). (D,E) A549 cells were transfected with non-targeting control or NP siRNA (100 nM) for 24 h followed by IAV PR8 infection (MOI 5). The cells were harvested 24 h.p.i, and total RNA was extracted followed by NP, FLNA, GAPDH (loading control for NP), and β-actin (loading control for FLNA) mRNA estimation via qRT-PCR. Results are shown as mean ± S.D. of three independent experiments (n = 9). Statistical significance was determined using Student’s t test and one-way ANOVA with post-hoc Tukey test, respectively (∗p < 0.05).

