FIGURE 4.
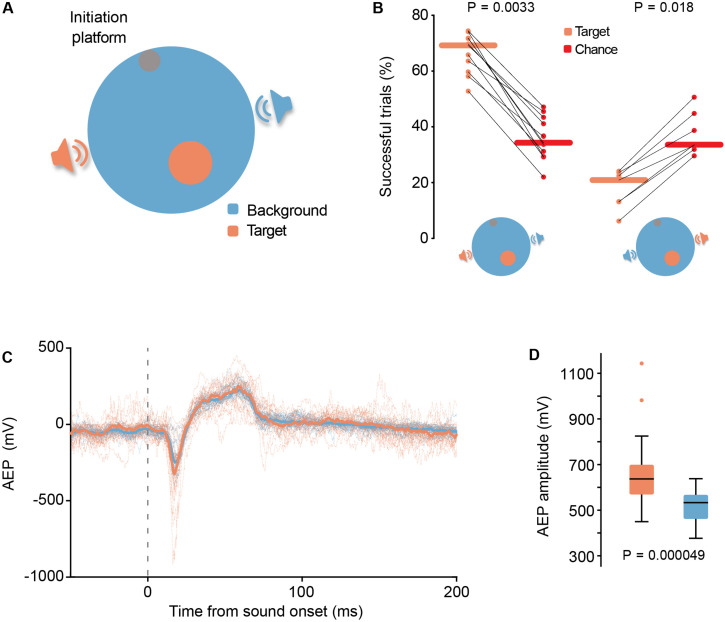
(A) Schematic representation (top view) of aSITloc, a sound source localization version of SIT. (B) Left-hand panel: Reporting of sound location was highly significant (P = 0.0033, N = 11 gerbils, Wilcoxon signed-rank test) compared to their chance level given their actual locomotion behavior, calculated by surrogate island computation. Right-hand panel: In 1/8 of the trials the identity of the target and background loudspeakers was swapped for a subset of the animals. A significant decrease in the performance for the “swapped” trials below chance level (P = 0.018, N = 7 gerbils, horizontal lines depict the median, Wilcoxon signed-rank test) suggests the animals were actively avoiding the target island under these conditions. (C,D) Response magnitude differences in auditory evoked potential (AEP) recordings of auditory cortex neural populations. (C) Single session example traces. Dotted lines represent AEP per trial and active loudspeaker identity. Thick traces represent the median of all trials. (D) Quantification of AEP amplitude. In this example session the AEP amplitude was significantly larger during target loudspeaker activity (P = 0.000049; Ntarget = 19, Nbackground = 23; Mann-Whitney U-test). Boxplots depict the median (black line), 1st and 3rd quartile (filled boxes), ± 2.7 σ (whiskers) and outliers (crosses).

