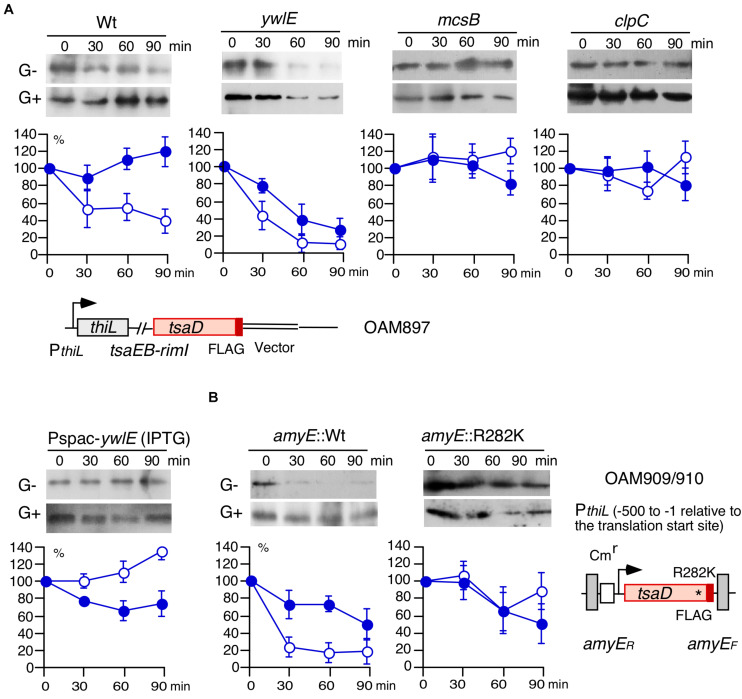
FIGURE 4.
Western blot analysis of TsaD-FLAG. Equal protein amounts of whole cell extracts were analyzed in 12.5% polyacrylamide gels for Western blots using anti-FLAG-tag monoclonal antibody. The chromosomal structures of OAM897 and OAM 909/910 are shown. Boxes and bent arrows show open-reading frames and promoters, respectively. The promoter region (−500/−1 relative to the translation start site) has full promoter activity (Ogura et al., 2019). (A,B) Protein stability analysis. Band intensities are shown in the graphs. After inhibiting protein synthesis, more than 100% of Arg-phosphorylated TsaD was sometimes observed. It is likely that apparent ratio of TsaD, if not degraded, to the total protein amounts increased due to other protein degradation systems. Time indicates culture sampling interval after chloramphenicol addition, which was added at T1 in sporulation medium culture. G+ and G− indicate the presence or absence of 2% glucose. Closed and open symbols indicate results from the medium containing glucose or no glucose, respectively. Means and SD (error bars) are shown from three to five biologically-independent samples. A, OAM897[wild], OAM898[ywlE], OAM899[mcsB], OAM900[clpC], and OAM901[Pspac-ywlE]. For OAM901, 1 mM IPTG (final concentration) was added. B, OAM909[wild] and OAM910[R282K mutant]. * indicates the introduced nucleotide change.

