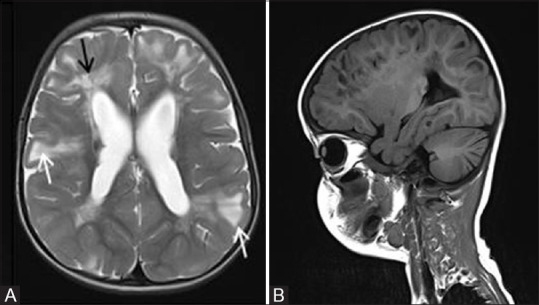
Figure 11 (A and B).

Axial T2-weighted image (A) of a 5-year-old boy with tuberous sclerosis complex shows cortical tubers as well-circumscribed areas of high signal intensity with widened gyri (white arrows). These areas appear hypointense on T1W sagittal image (B). Note made of radial migration line appearing as linear and curvilinear band of hyperintensity extending from the juxta-ventricular white matter to the cortex (black arrow)
