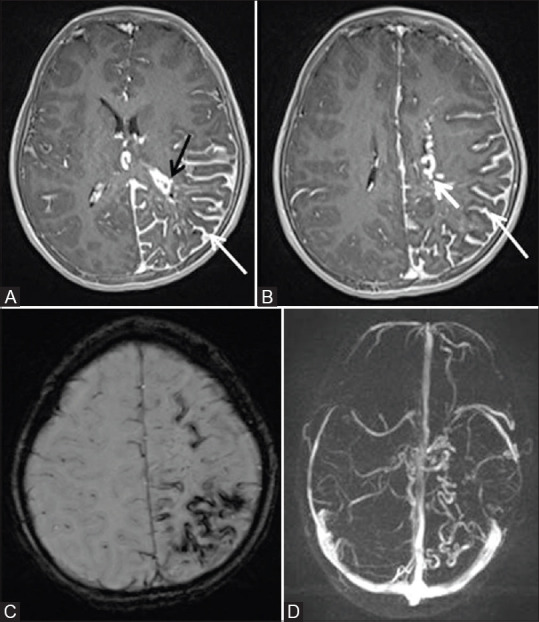
Figure 17 (A-D).

Post contrast fat sat T1W axial (A and B) MR images of the same child as shown in Figure 16, showing diffuse pial angioma (thin white arrow) in left cerebral hemisphere with atrophy of underlying cortex. Note made of enlargement of choroid plexus in left lateral ventricle (black arrow) and enlarged deep medullary veins on left side (thick white arrow). Susceptibility weighted axial MR image (C) showing curvilinear areas of blooming noted in left cerebral hemisphere consistent with calcification. MR Venography reconstructed image in axial plane (D) showing relative paucity of superficial cortical veins with prominent deep medullary veins in the affected left cerebral hemisphere
