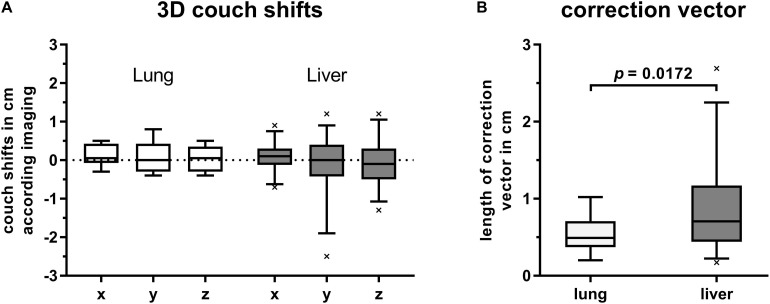
FIGURE 2.
Box plots with boxes extending from 25th to 75th percentiles. Whiskers are drawn down to 5th and up to 95th percentiles, respectively. (A) Couch shifts are shown in left (+) to right (–), cranial (+) to caudal (–) and anterior (+) to posterior (–) directions along the x-, y-, and z-axis, respectively. Values were grouped by target location and derived from first CBCTs for position verification after alignment of current DIBH surface to that of the reference surface. (B) Length of correction vectors of first CBCTs for image-guidance in DIBH and grouped by target location. Statistical difference was calculated by Welch’s t-test.

