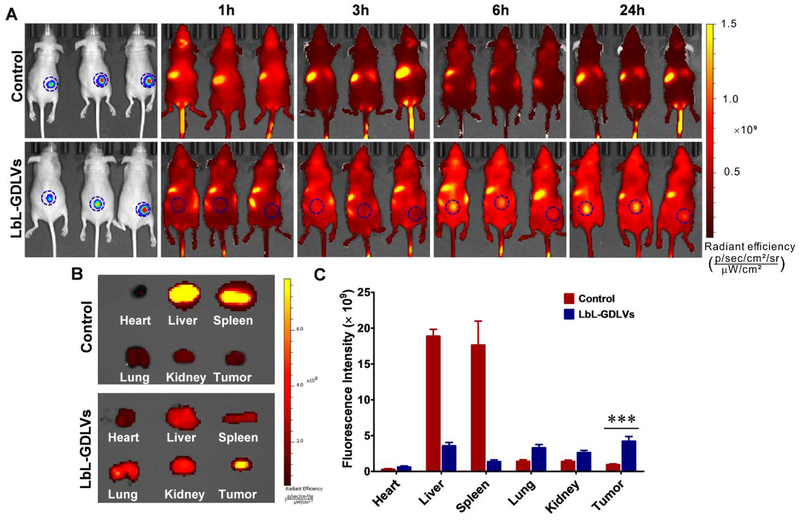
Figure 5. LbL-GDLVs exhibit improved tumor delivery and penetration in Luc-HT-29 tumor-bearing mice in vivo.
A. In vivo imaging of mice at 1, 3, 6 and 24 h after intravenous injection (i.v.) of DiR-labeled LbL-GDLVs or control nanoparticles that had dextran sulfate sodium (DSS) as their outer layer (n=3). B. Ex vivo images of Luc-HT-29 tumors and other tissues (heart, liver, spleen, lung, and kidney) at 24 h after injection (n=3). C. Region of interest (ROI) data analysis of DiR fluorescent signals from tumors and normal tissues. Results are expressed as mean fluorescence intensity ± SD (n=3); ***p<0.001.

