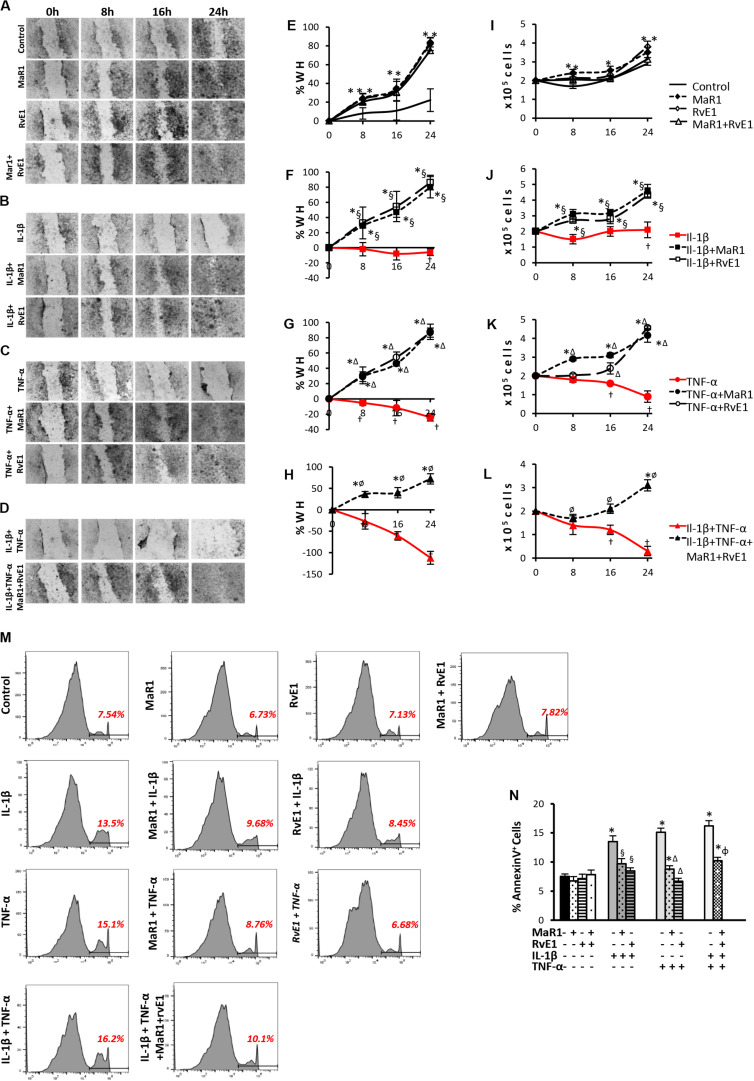
FIGURE 2.
Analysis of hPDLSCs migration, viability, and apoptosis in wound closure assay using scratches in monolayers with ∼2 × 10⁵ cells unstimulated (control) or stimulated under different experimental conditions. (A–D) representative images in 10X magnification at each time-point (Baseline/0, 8, 16, and 24 h). (E–H) percentage of wound healing at each time-point. Positive values correspond to the reduction of the wound area, and negative values correspond to an increase in this area. (I–L) values relative to the total number of viable cells using MTT assay at each time-point. (M) representative histograms of flow cytometry analysis using AnnexinV set in unstained cells to analyze positive populations. (N) Percentage of AnnexinV+ hPDLSCs (early apoptotic cells) after 24 h treatment under different conditions. (*) p < 0.05 vs control (non-stimulated); (§) p < 0.05 vs IL-1β treated group; (Δ) p < 0.05 vs TNF-α treated group; and (ø) p < 0.05 vs IL-1β +TNF-α treated group. ANOVA with post-hoc test Tukey was used to determine statistical differences between experimental groups at the 0.05 level. Results are given as mean ± SEM of three independent experiments.

