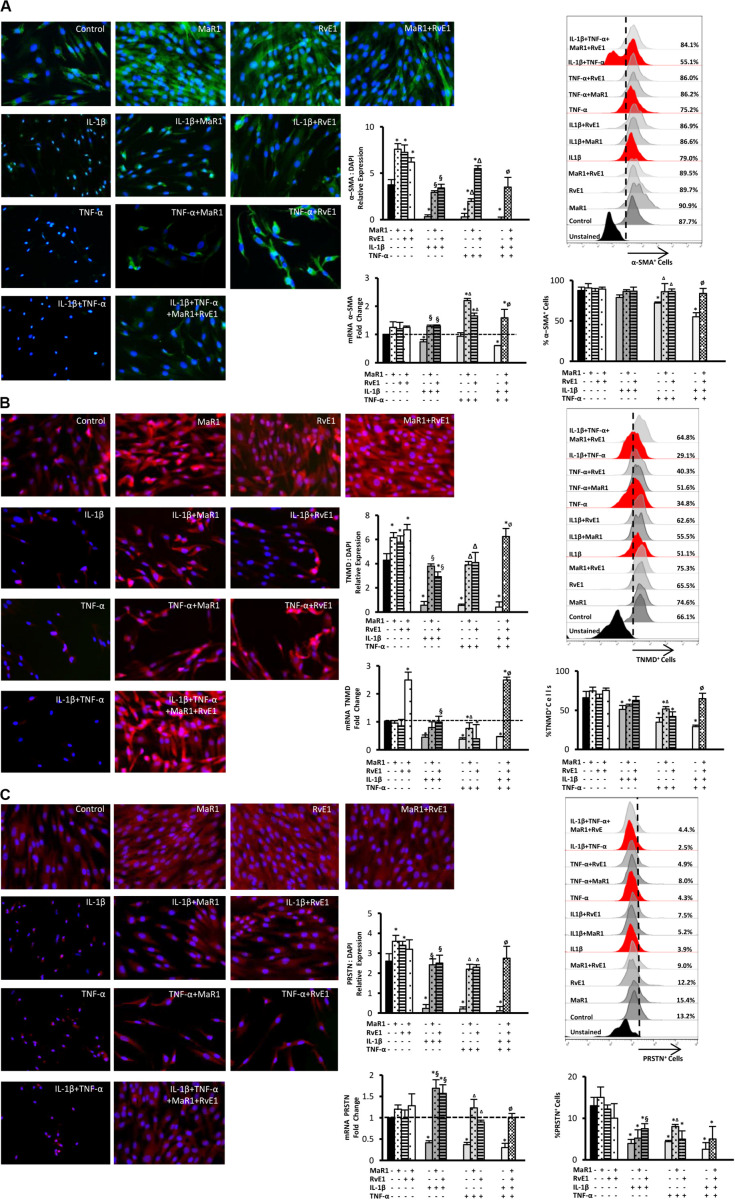
FIGURE 3.
Analysis of the periodontal ligament-like cell markers: α-SMA (A), tenomodulin (TNMD), (B), and periostin (PRSTN; C) after 24 h of stimuli with mediators. Immunofluorescence representative images in 40X magnification. Protein expression was analyzed by immunofluorescence intensity relative expression in relation to DAPI. Relative gene expression (mRNA) was evaluated by qPCR using GAPDH as endogenous control and the ΔΔCT method. Flow cytometry analysis was used to measure the percentage of positive hPDLSCs for each marker, and unstained cells were used to set positive cell populations. (*) p < 0.05 vs control (unstimulated); (§) p < 0.05 vs IL-1β treated group; (Δ) p < 0.05 vs TNF-α treated group; and (ø) p < 0.05 vs IL-1β +TNF-α treated group. ANOVA with post-hoc test Tukey was used to determine statistical differences between experimental groups at the 0.05 level. Results are presented as mean ± SEM of three independent experiments.

