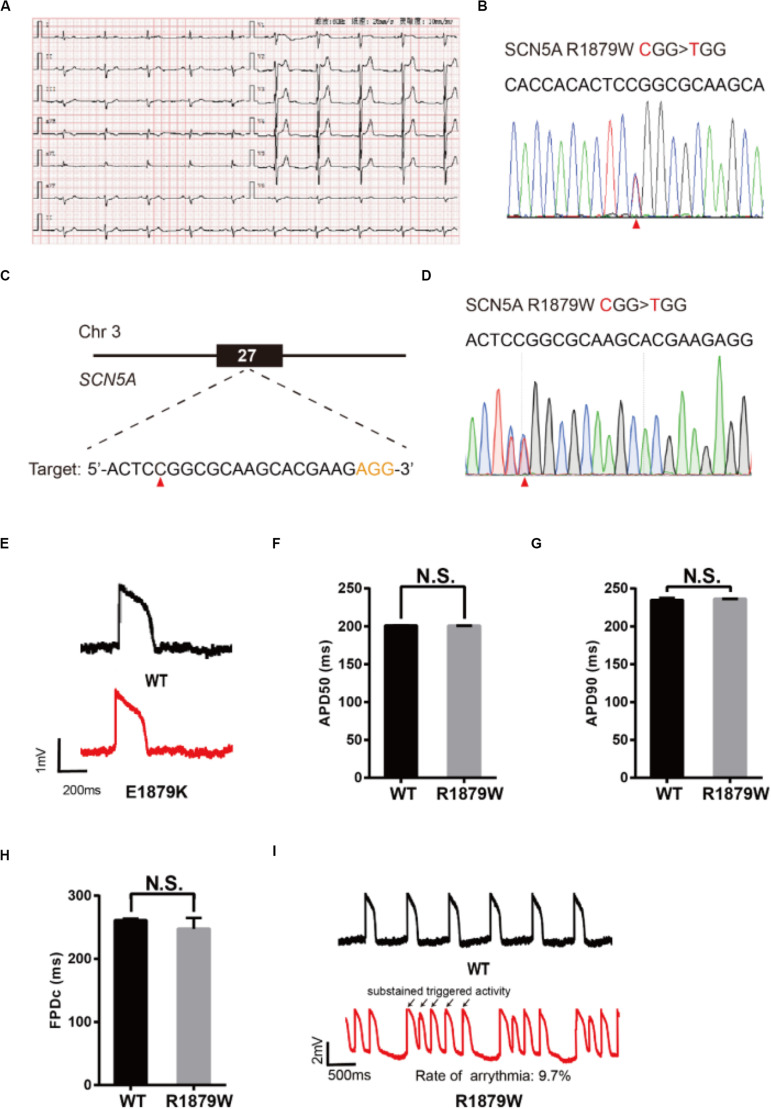
FIGURE 5.
Evaluation of R1879W-SCN5A mutation. (A) Patient’s ECG results. The resting ECG showed an ST elevation in leads V1–V3 with a saddle-back pattern. (B) Sanger sequencing reveals that a C to T mutation occurs on SCN5A. (C) R1879W target site on SCN5A. PAM sequence is shown in orange; target nucleotide is indicated by a red triangle. (D) A heterozygous clone is confirmed by Sanger sequencing. The mutated nucleotide is shown in red; the mutated nucleotide is indicated by a red triangle. A neighbor nucleotide C is changed to T, but it does not change the amino acid. (E) Single trace of action potentials in WT-CMs and R1879W-CMs. (F,G) Quantification of action potential at APD50 and APD90. n = 3 independent experiments, unpaired t-test. (H) Quantification of corrected field potential duration (FPDc). n = 3 independent experiments, unpaired t-test. (I) Representative action potential traces with sustained triggered activity. Triggered beats were labeled by black arrows.

