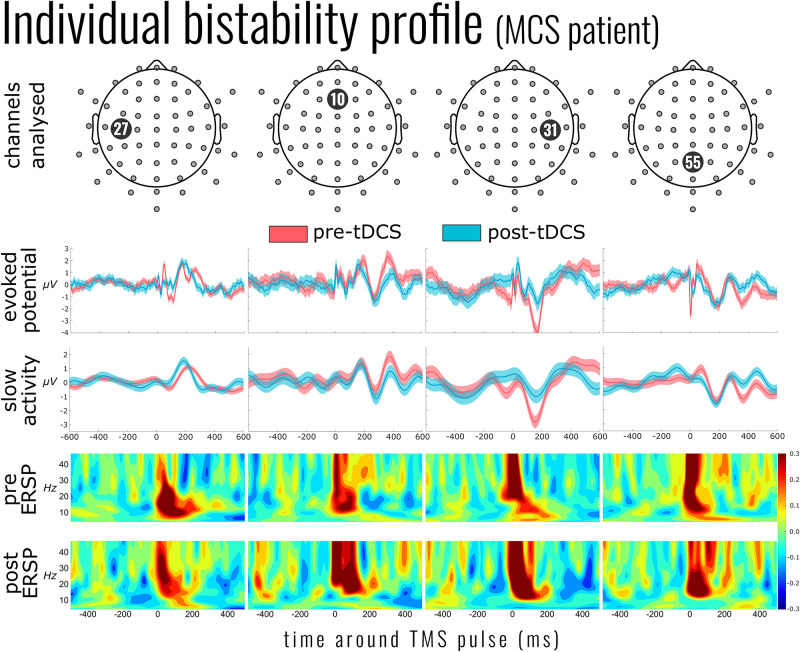
FIGURE 1.
Individual bistability profile of a patient in minimally conscious state (MCS; patient 6). Top panel indicates the exemplar channels 27, 10 [channel in the center of the supposed effect area of the transcranial direct current stimulation (tDCS)], 31 [nearest channel to the transcranial magnetic stimulation (TMS) pulse], and 55. The evoked potential panel shows the average electroencephalography (EEG) activity 600 ms before and after the single TMS pulses (mean of 267 pulses pre-tDCS and 220 post-tDCS). Below this is the mean slow activity, a low-pass-filtered signal of the TMS-evoked potential. The slow activity profile of channel 31 (third column) shows the reduction of slow activity after tDCS. The two panels below show the event-related spectral perturbation before and after tDCS intervention. Yellow to red indicates an increase in the power of the corresponding frequency (compared to the mean baseline activity), while shades of blue indicate a suppression of those frequencies.

