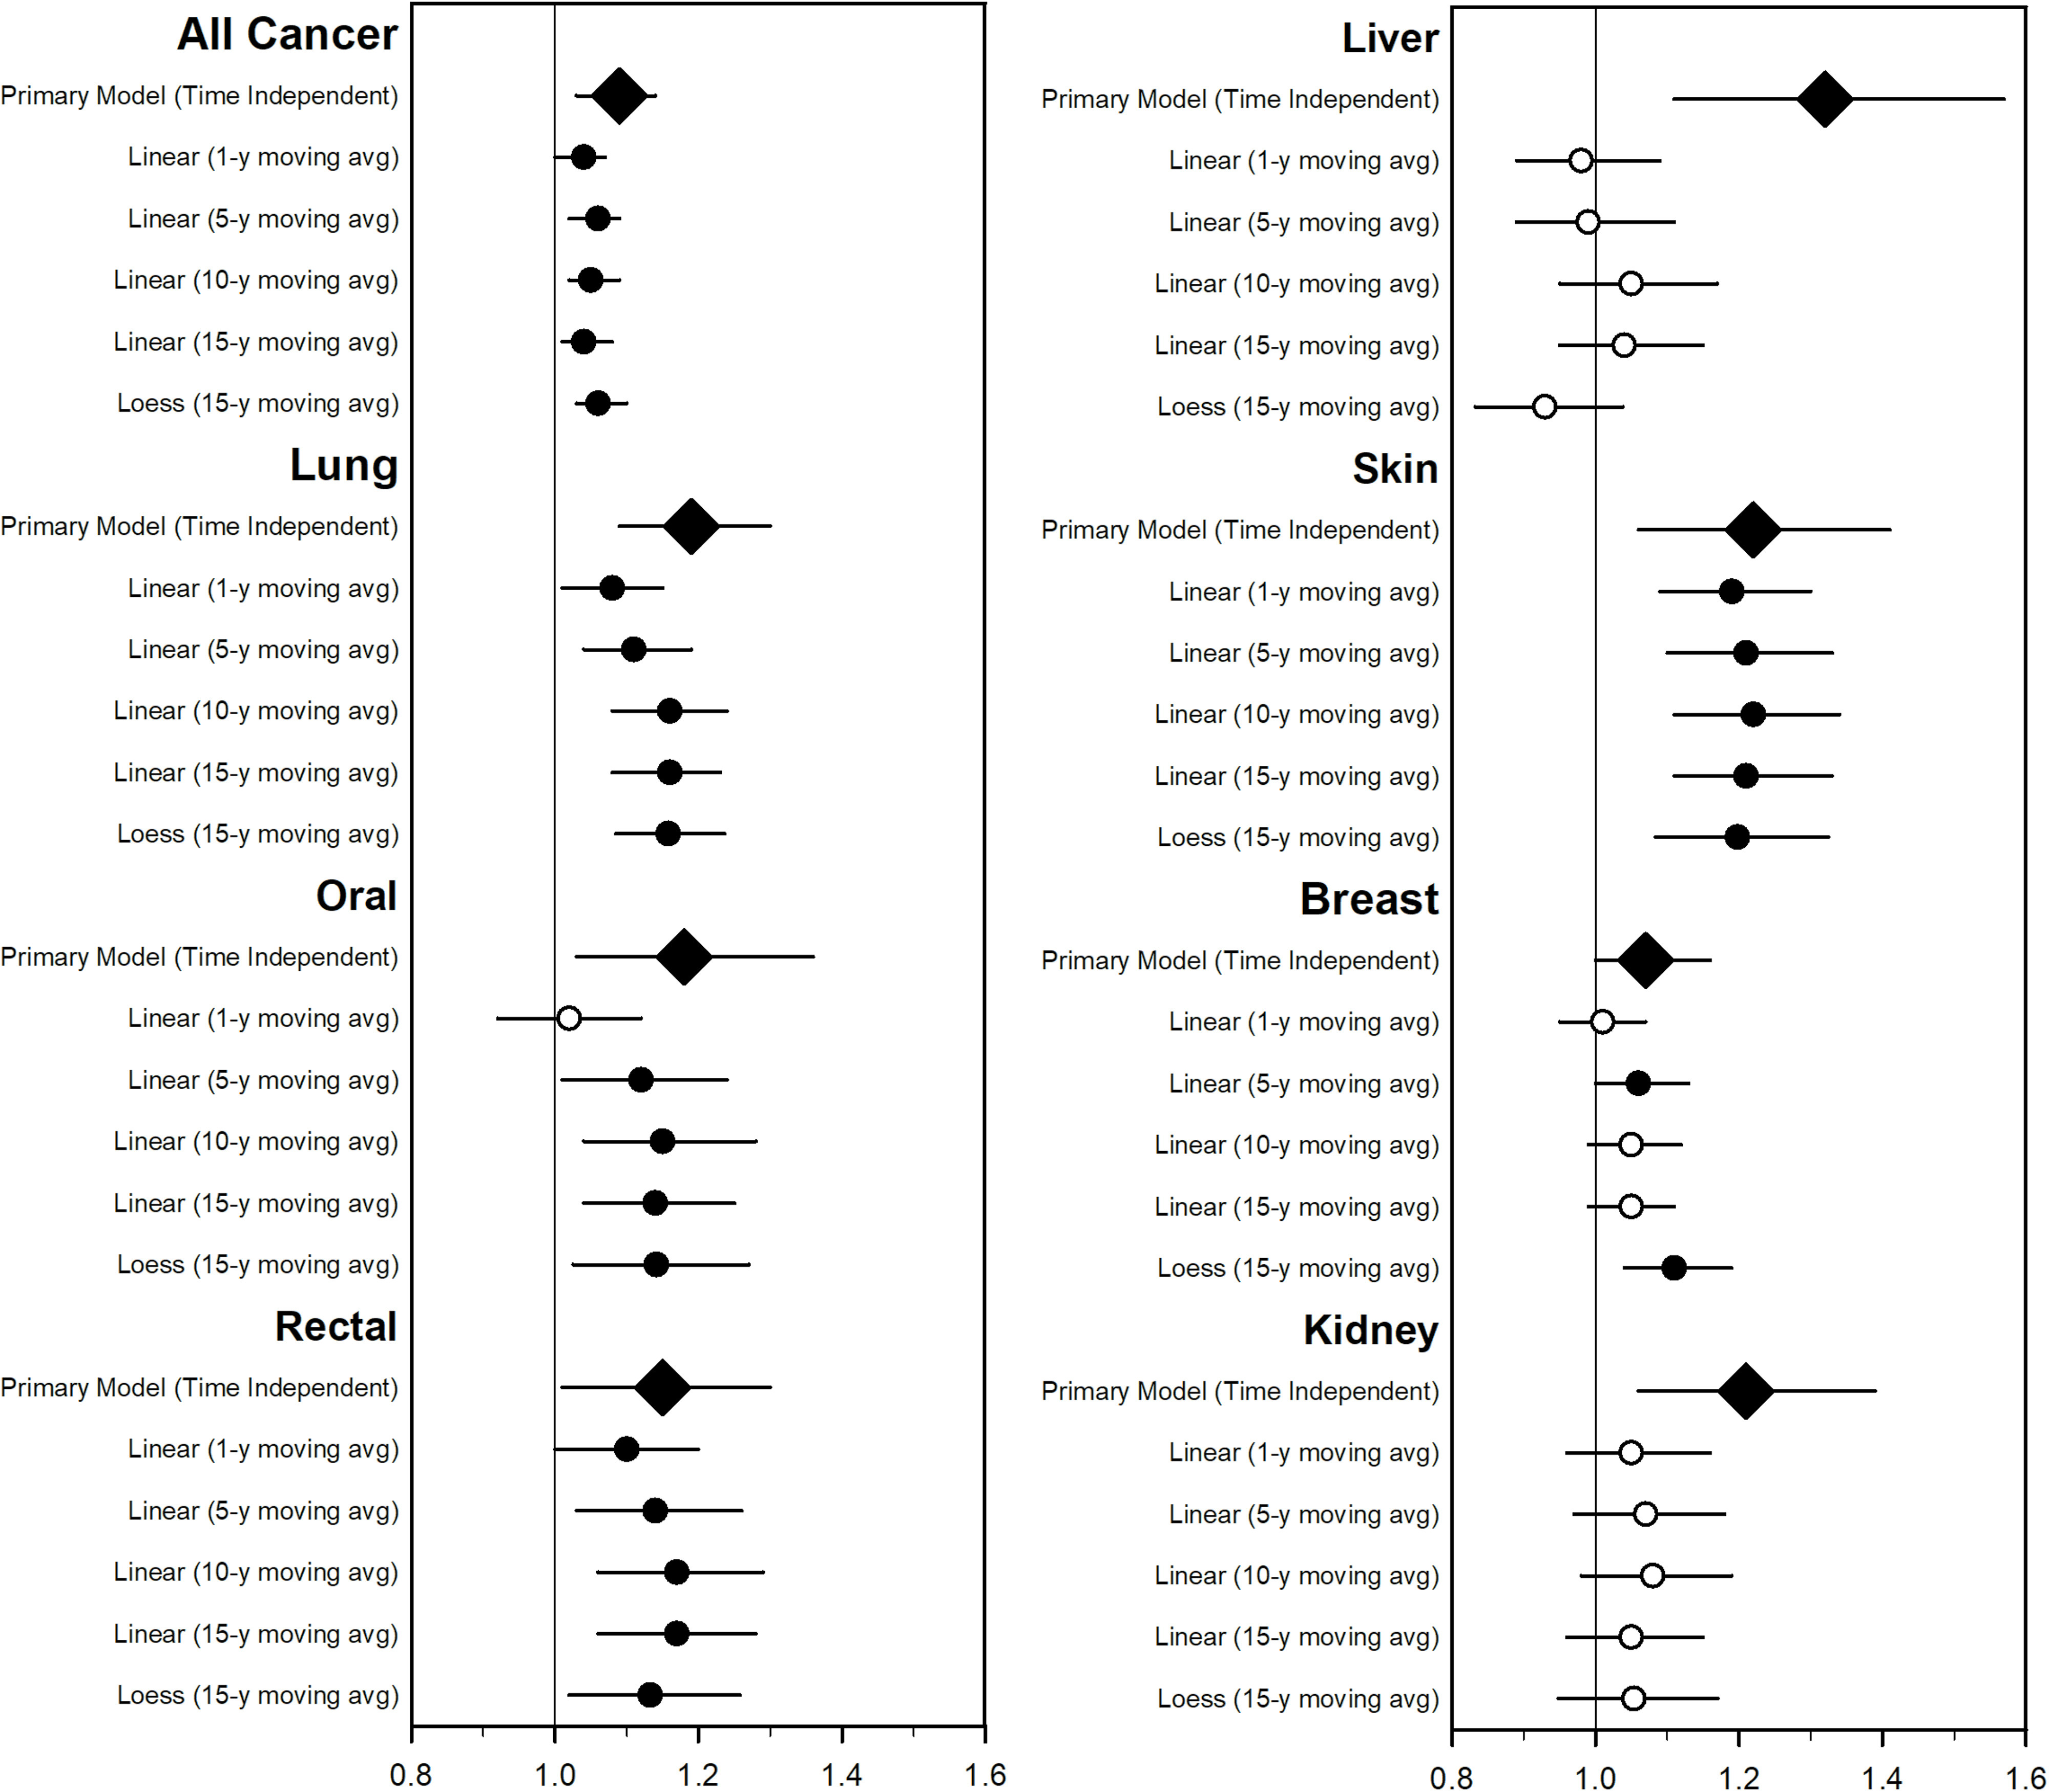
Figure 2.

Estimated incident rate ratios (95% CIs) associated with a increase of and selected cancer type incidence from 2002–2011 using time-varying models and compared with the base (time-independent) model. Numerical estimates are included in Table S2. Open circles represent that estimates were not statistically significant at a 0.05 level. Diamonds represent the base (time-independent) model. Models adjusted for percentage of the county in various age buckets; percentage male; percentage white, black, Hispanic, and other; percentage who did not graduate high school, graduated high school, or obtained more education than high school; median income, rent, and home value; percentage below 150% poverty; percentage working class; percentage unemployed; percentage living in a rural area; percentage smokers; percentage alcohol consumption; percentage who are physically active; and percentage of individuals in a county who are obese as well as indicator variables for urban/rural, state, and year. The primary (time-independent) model used a LOESS model with 3 df for all covariates. The linear models used linear yearly estimates for all covariates and 1-, 5-, 10-, and 15-y moving average estimates for exposure. The LOESS model was a locally weighted smoothing model with 3 df for all covariates with a 15-y moving average lagged estimate for exposure. Note: CI, confidence interval; df, degrees of freedom; , particles in aerodynamic diameter; LOESS, locally weighted smoothing model.
