Table 2 |.
Conversion of a range of substrates using NMN+ as the cycling cofactor
| Substrate | Product | Enzyme | Substrate concentrationa | Conversion (%) |
|---|---|---|---|---|
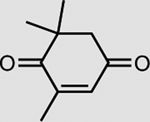 |
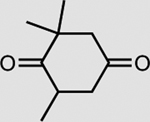 |
XenA | 33 mM | >99 |
 |
 |
XenA | 10 mM | 76 ± 2 |
| XenA | 50 mM | 49 ± 3 | ||
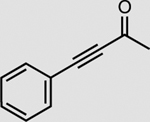 |
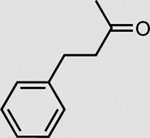 |
OYE3 | 5 mM | >99 |
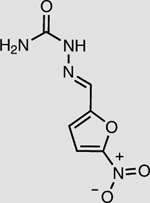 |
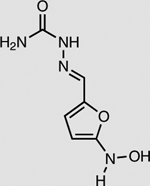 |
NfsB | 2 mM | 92 ± 1 |
| Cytochrome c (oxidized) | Cytochrome c (reduced) | P450 BM3 W1046S | 50 μM | >99 |
Reactions were preformed in 200 mM potassium phosphate buffer (pH 7.5), 1 M NaCl, 300 mM d-glucose, 6 mM NMN+, and substrates at 30 °C while mixing for 24 h. Bs GDH was supplied at 0.33 mg ml−1. XenA, OYE3, NsfB, and P450 BM3 W1046S were supplied at 0.75 mg ml−1. Values are an average of at least three replicates with values after ± represent one standard deviation.
Substrate concentration was limited by substrate solubility in the buffer.
