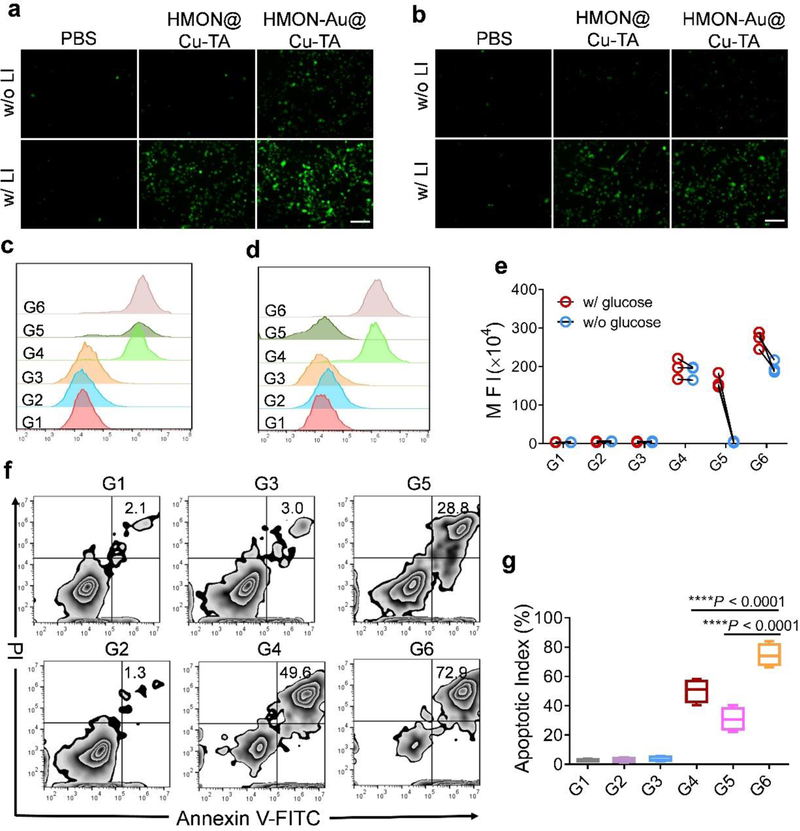
Figure 2.
(a-e) The detection of intracellular ROS generation after treatment using a ROS fluorescence probe DCFH-DA as the indicator. Fluorescence images (a) and flow cytometric analysis (c) of ROS generation in BxPC-3 cells after indicated treatment in the culture medium with glucose. Fluorescence images (b) and flow cytometric analysis (d) of ROS generation in BxPC-3 cells after indicated treatment in the culture medium without glucose. (e) The quantification of mean fluorescence intensity (MFI) in BxPC-3 cells after indicated treatment. (f) Flow cytometric analysis of apoptosis in BxPC-3 cells after indicated treatment. (g) The quantification of apoptotic index in BxPC-3 cells after indicated treatment. Scale bar, 100 μm. G1, PBS without LI; G2, PBS with LI; G3, HMON@Cu-TA without LI; G4, HMON@Cu-TA with LI; G5, HMON-Au@Cu-TA without LI; G6, HMON-Au@Cu-TA with LI. Data are presented as means ± s.d. Statistical significance was calculated via one-way ANOVA with Tukey post-hoc test (g).*P < 0.05, **P < 0.01, ***P < 0.001, ****P < 0.0001.

