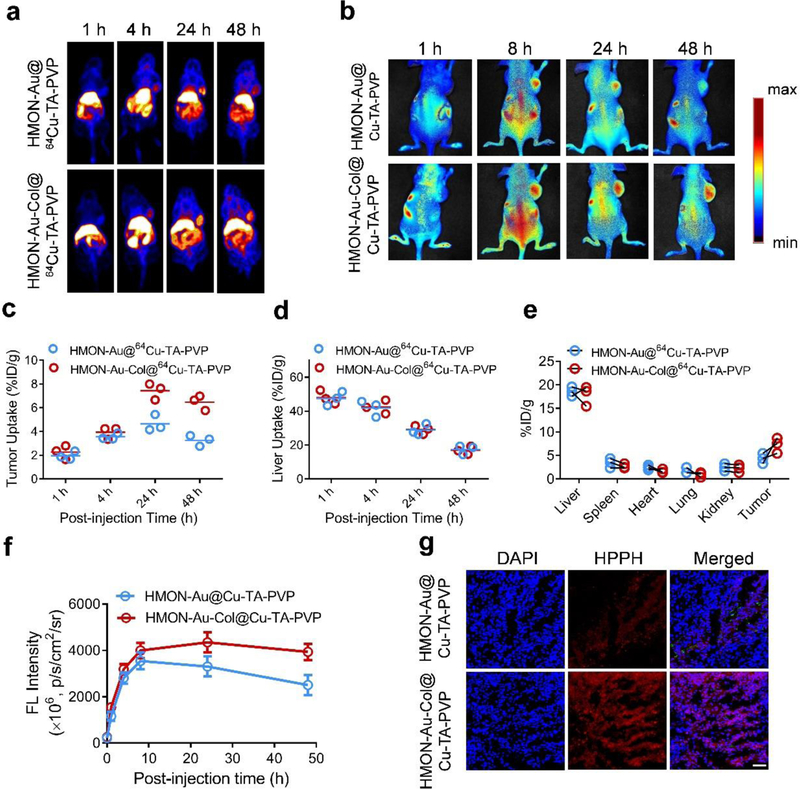
Figure 4.
In vivo distribution of HMON-Au@Cu-TA-PVP and HMON-Au-Col@Cu-TA-PVP nanoparticles in tumor-bearing mice. (a) Representative in vivo images of tumor-bearing mice at designated time point after intravenous injection with indicated formulation detected by PET imaging. (b) Representative in vivo fluorescence images of tumor-bearing mice after intravenous injection with indicated formulation. (c, d) The quantification of tumor uptake (c) and liver uptake (d) of HMON-Au@64Cu-TA-PVP or HMON-Au-Col@64Cu-TA-PVP nanoparticles over time by PET scanning at 1, 4, 24, and 48 h post injection. (n = 3/group) (e) The quantification of the PET signal intensity in the main organs of tumor-bearing mice at 48 h post injection. (f) The quantification of the fluorescence signal intensity in tumor at designated time point after indicated treatment. (g) Representative confocal laser scanning microscopy (CLSM) images of the tumor frozen section after indicated treatment. Scale bar, 100 μm.

