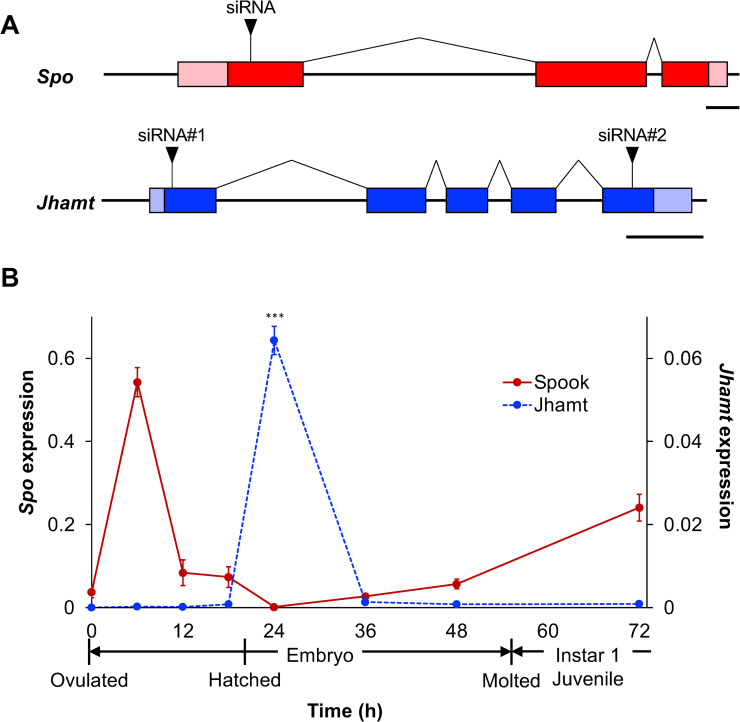
Fig 1. Gene structures and temporal expression patterns of Spo and Jhamt during embryogenesis.
(A) Schematics of Spo (red) and Jhamt (blue) genes. Coding sequences (CDSs) are shown in dark-colored boxes and untranslated regions (UTRs) are indicated in light-colored boxes. siRNA target sites are denoted by black triangles. Scale bar, 250 nt. (B) Expression of Spo (red) and Jhamt (blue) during embryogenesis quantified by qRT-PCR. Timing of hatching and molting to instar 1 juveniles are shown under the x-axis. Expression levels are normalized to those of the reference gene ribosomal L32. Values are means. Error bars represent SD (N = 3). ***p<0.001 (Student’s t-test).

