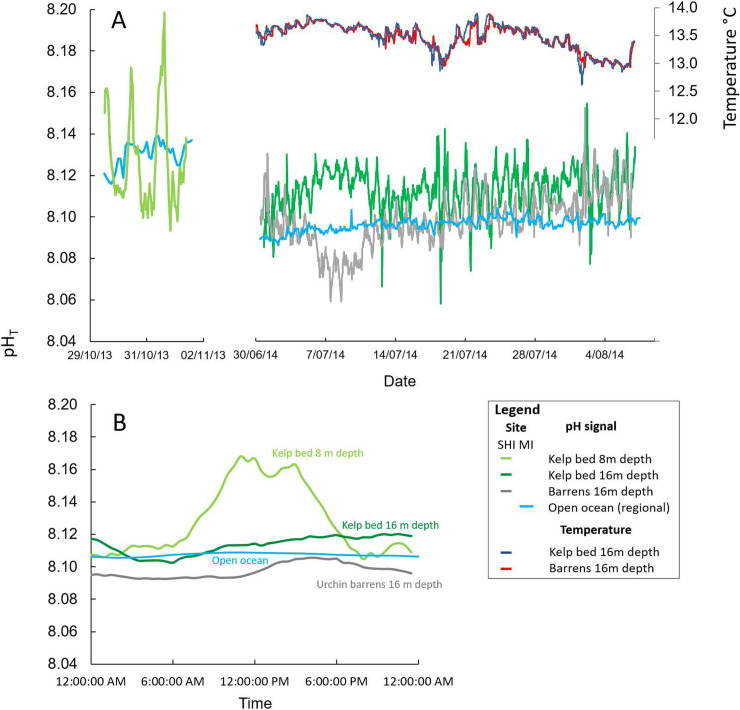
Fig 3. Kelp bed elevation of local pH relative to barrens ground.
(A) pH traces from automated loggers in kelp beds (green) and urchin barrens (grey) at St. Helens Island (SHI); for shallow kelp beds (LHS plot, from 29th to 31st Oct 2013; see legend), and for deeper (16 m depth) kelp beds and barrens ground (RHS plot, from 5th June to 7th Aug 2014); temperature traces in kelp beds and barrens (navy blue and red, respectively) and open ocean pH (blue) are also shown, see legend. (B) Composite plot of mean diurnal pH for shallow kelp beds (Oct 2013), deep kelp beds (June-Aug 2014), regional open ocean surface pH (June-Aug 2014 at Maria Island (MI)), and urchin barrens (June-Aug 2014); see S3 Fig for seaonality in regional open ocean surface pH and temperature in S1 File.

