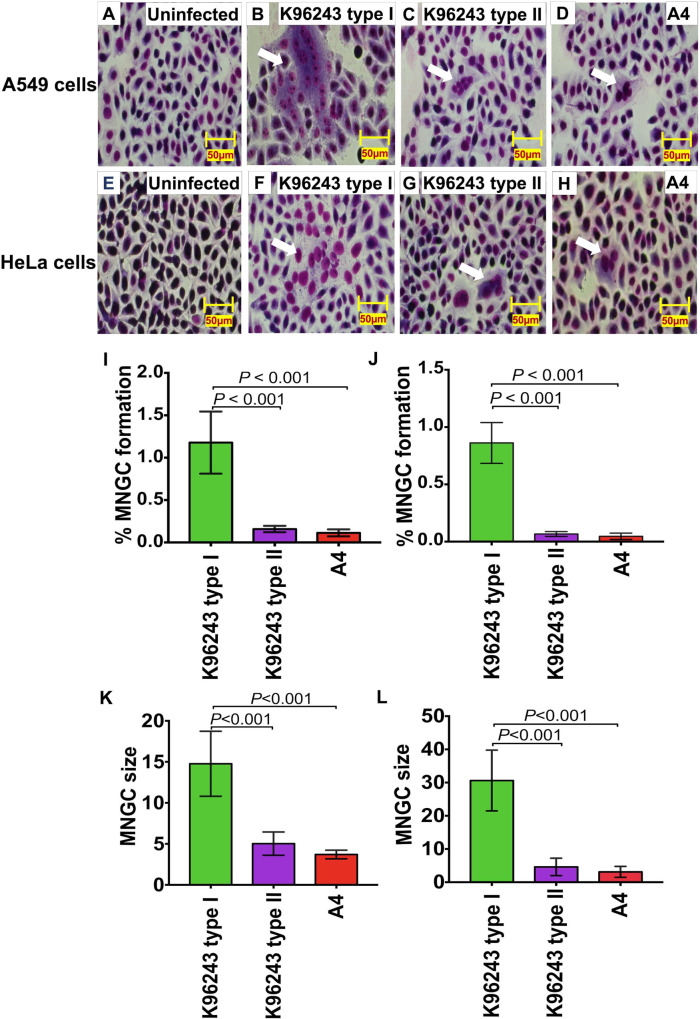
Fig 3. B. pseudomallei K96243 type II and A4 are defective in MNGC formation in A549 and HeLa cells.
A549 cells (A) and HeLa cells (E) were infected with B. pseudomallei K96243 type I (B and F) and K96243 type II (C and G) and A4 (D and H) at MOI of 50 at 37°C for 12 h. The cells were stained with Giemsa stain. Percent MNGC formation in A549 cells (I) and HeLa cells (J) were quantified by number of nuclei in MNGCs x 100/total number of nuclei. The average size of MNGC in A549 (K) and HeLa cells (L) are shown as means ± standard deviation. Average MNGC size was calculated by total number of nuclei in MNGCs/total number of MNGCs. All assays were performed on two independent experiments in triplicate. Student’s t-test was performed to test the differences between bacterial strains. Scale Bars, 50 μm.

