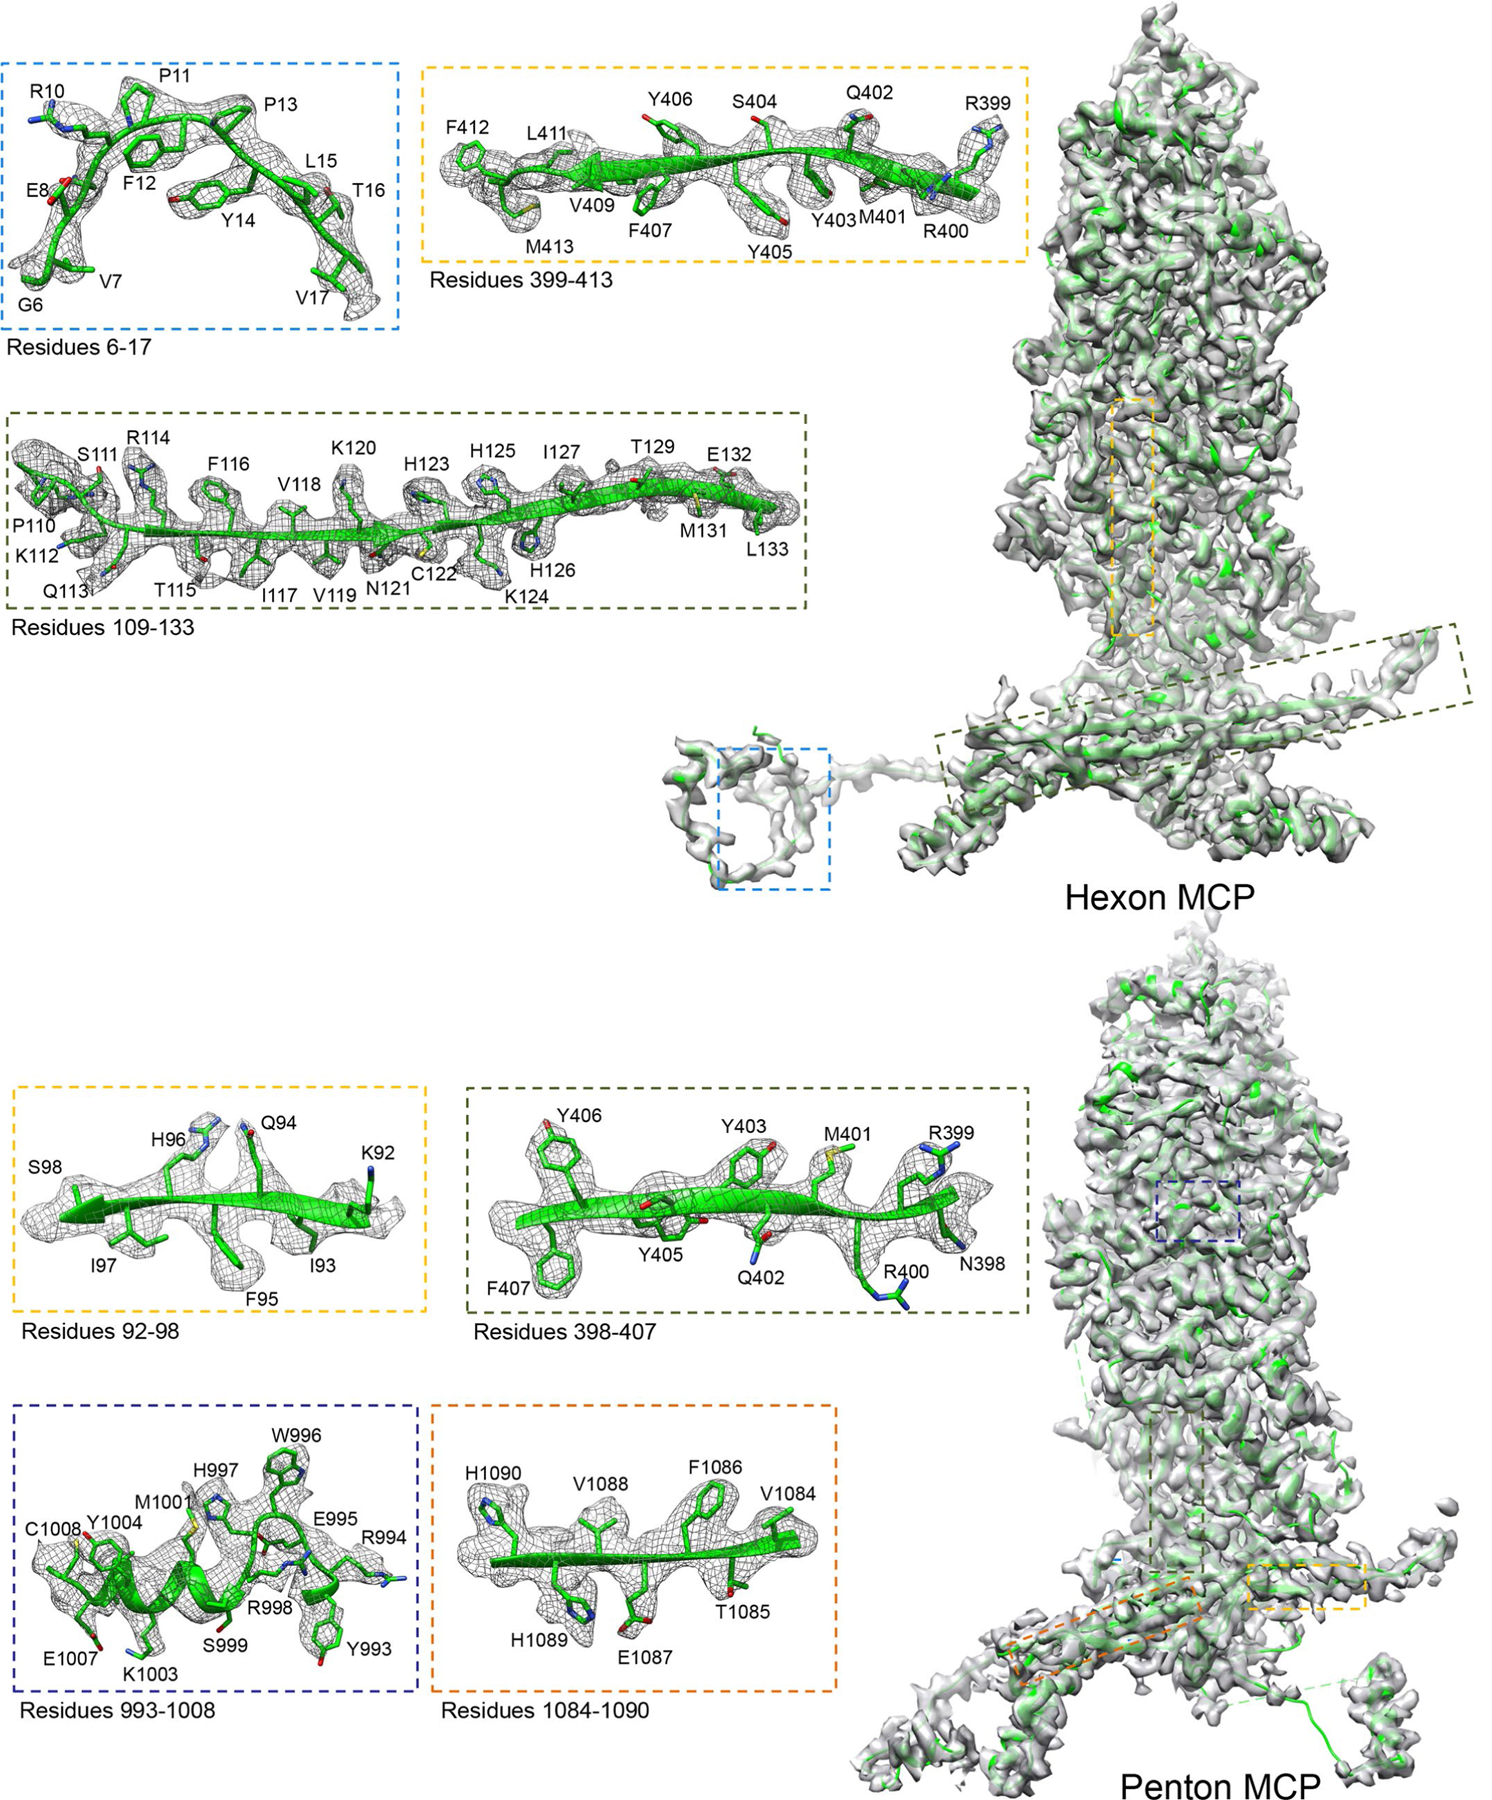
Extended Data Fig. 1 |. Density maps (gray) and atomic models (ribbon) of a P4 hexon MCP and a penton MCP segmented from the C2 2-fold and the C5 CATC-absent 5-fold sub-particle reconstructions.

Boxed regions are enlarged in boxes with edges colored correspondingly, with density shown as gray mesh and atomic models as ribbon/sticks.
