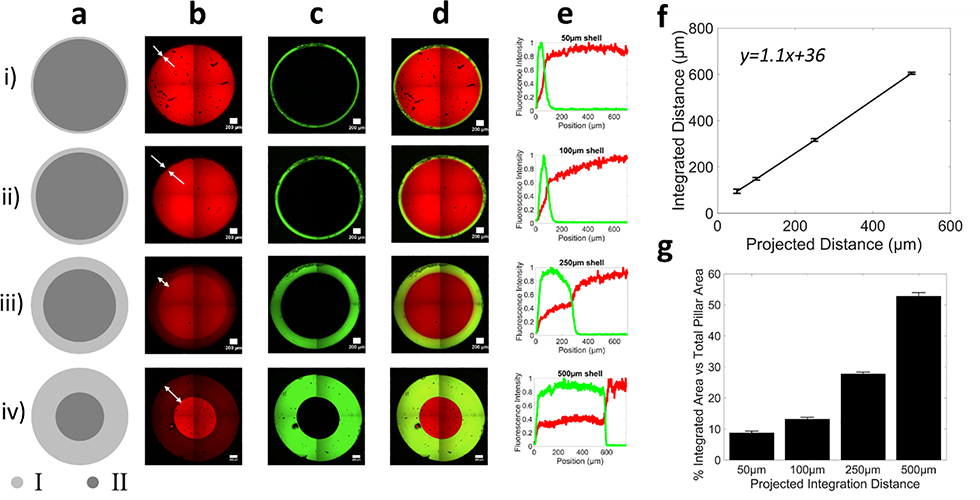
Figure 4.
Grayscale illumination to spatially control the local properties of material #1 (red) to control integration of material #2 (green). a) Digital projected image of illumination pattern showing a core at high (~100%) and a shell at low (13.5%) conversion. Region I shell thickness is 50 μm in (i),100 μm in (ii), 250μm in (iii) and 500 μm in (iv) for 2 mm diameter hydrogel pillars. Representative confocal microscopy images of b) material #1, c) material #2, and d) the composite image. Representative confocal microscopy images were stitched from four images and it recapitulates the digital image. e) Line profiles of each fluorescence intensity across the integration region. In all cases, no integration is observed in the core. f) The projected distance for different shell patterns predicts the true thickness of the interfacial region. g) Percentage area of shell and core in the pillars, where the percentage integrated area corresponds to the shell area. Data are presented as mean with standard deviation as error bars for n=5.

