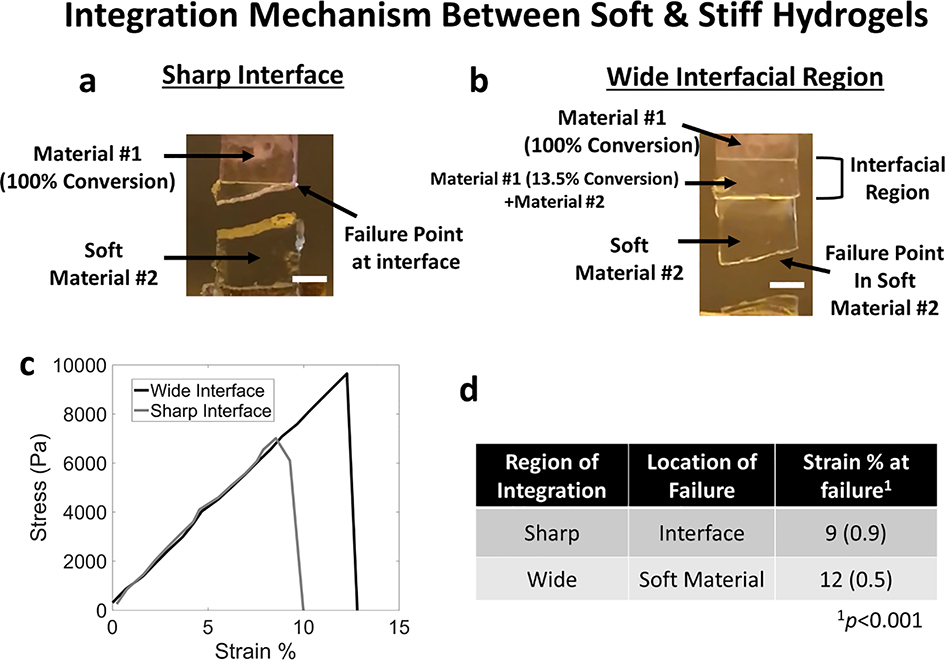
Figure 5.
Tensile tests were performed to failure for a composite material composed of material #1 and #2 with (a) a sharp interface and (b) a programmed integrated region. Digital photographs are shown for a representative sample after failure. c) Representative stress vs strain plot for a composite material with a sharp interface (grey) or wide interface (black). d) Tabulated summary of findings. Data are presented as mean and standard deviation for n=3–4. Scale bar: 2mm

