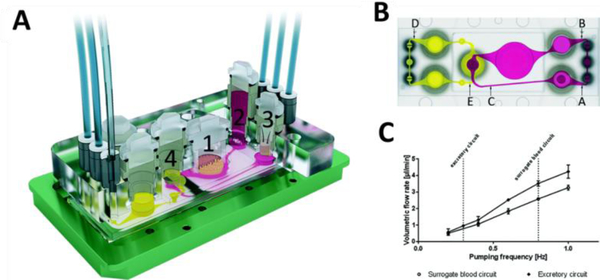
Figure 4.
(A) Four organ MoC device used to study the distribution, absorption, metabolism, and excretion profiles of drug candidates with repeated doses to assess systemic toxicity. The numbers correspond to the culture organs including (1) intestine, (2) liver, (3) skin, and (4) kidney. B) Schematic of locations in which microparticle image velocimetry was employed for flow analysis, where A, B and C are sample points for the surrogate blood circuit and D and E are for the excretory circuit. (C) The average volumetric flow rates versus pumping frequency for both the surrogate blood and excretory circuit. Pumping was driven by two on-chip peristaltic micropumps capable of circulating the media for weeks. Reproduced from [36a] with permission from the Royal Society of Chemistry.

