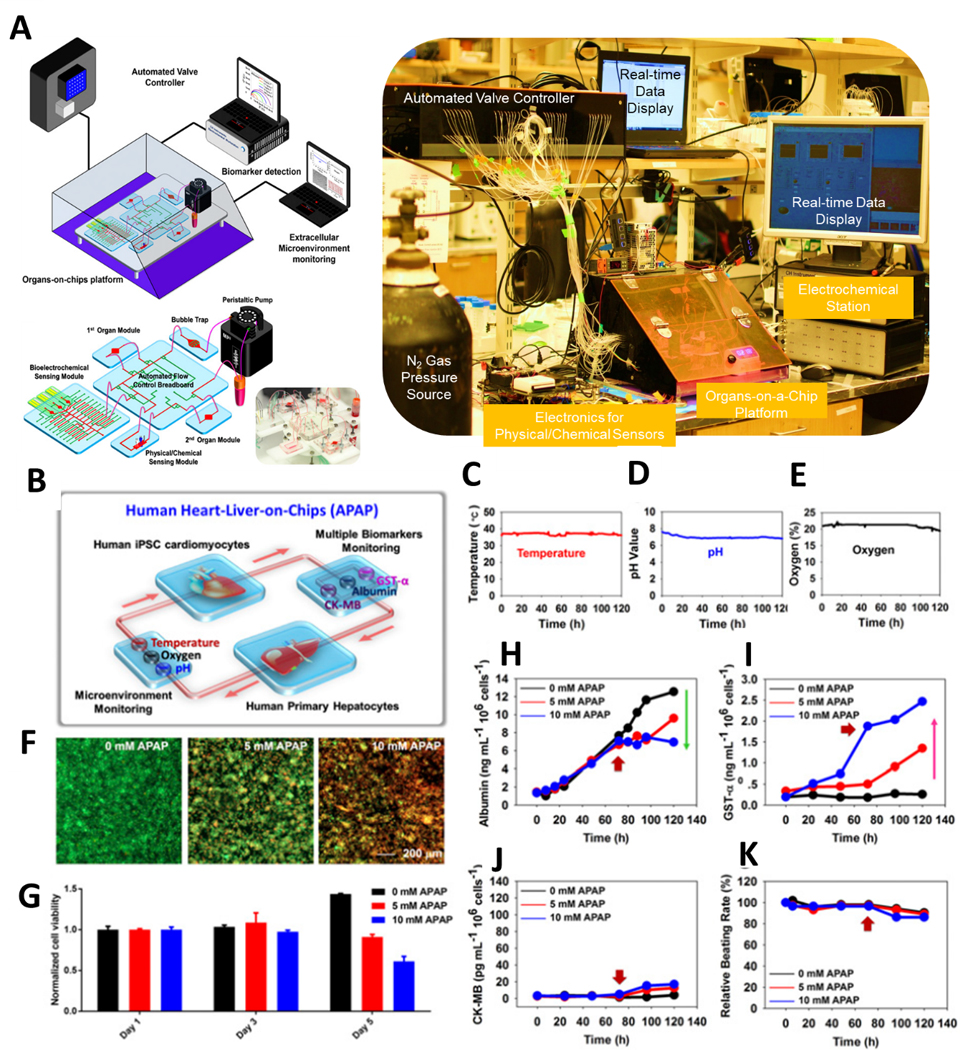
Figure 7.

(A) Schematic and MoC microfluidic device layout with external device controls and monitors. (B) Liver-and-heart MoC and liver-cancer-heart MoC devices with integrated sensors (pH, O2, temperature, and electrochemical immunobiosensors) and a miniature microscope to study drug effects. Continual measurements of (C) Temperature, (D) pH and (E) oxygen with on-chip sensors. F) Live/dead staining of the liver organoids after drug administration and (G) normalized cell viability in response to acetaminophen. Continual electrochemical detection of (H) albumin, (I) GST-α, and (J) CK-MB with on-chip immunobiosensors. (K) Beating rate over time of cardiac tissue. (F-K) data monitored the cellular responses over 5 days, where the red arrows indicate the addition time of acetaminophen (72hr). Reproduced from [56] with permission from the National Academy of Sciences.
