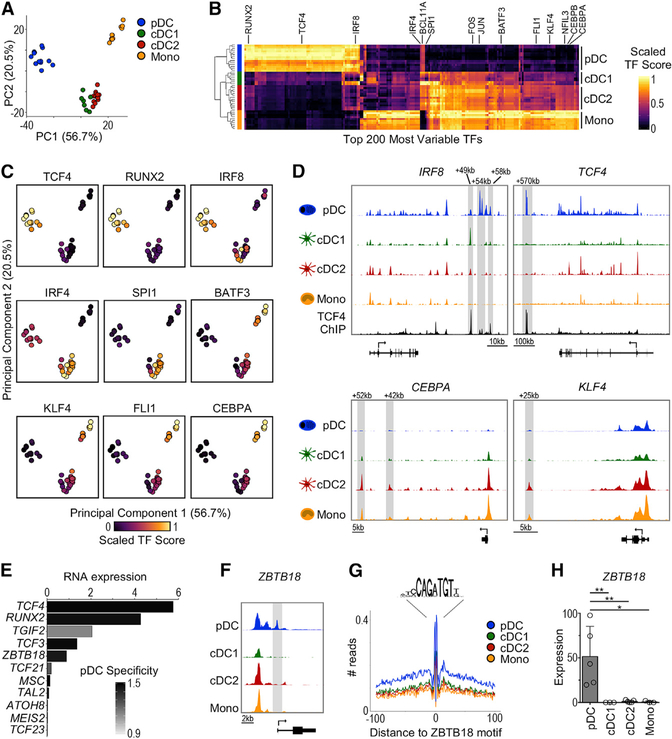
Figure 2. ATAC-Seq Reveals an Undescribed Transcriptional Regulator in pDCs.
(A) PCA based on TF activity scores (TF score) calculated by chromVAR.
(B) Heatmap of top 200 most variable TFs (columns) across subsets (rows). The color indicates scaled TF score.
(C) PCA as in (A) colored by scaled TF score.
(D) Chromatin accessibility around the IRF8, TCF4, CEBPA, and KLF4 loci. The tracks are from 1 representative donor. The TCF4 ChIP-seq track (Ceribelli et al., 2016) is shown for IRF8 and TCF4.
(E) pDC-specific TFs identified by chromVAR that also demonstrate higher mRNA expression in pDCs. The x axis represents the mean mRNA expression in pDCs measured by scRNA-seq (Villani et al., 2017). The bars are colored by pDC specificity compared to other DC subsets (Z score).
(F) Genome tracks of ZBTB18 locus from 1 representative donor showing transcript variant 1.
(G) ZBTB18 HINT-ATAC footprint from genome-wide binding sites. The data are pooled from all of the samples for each subset.
(H) ZBTB18 transcript variant 1 expression measured by RT-PCR, n = 3–5 in 2–4 independent experiments. The statistics are determined by 1-way ANOVA with Dunnett’s multiple comparisons test.
Bar graphs show means ± SDs. *p < 0.05 and **p < 0.01. See also Figure S2.

