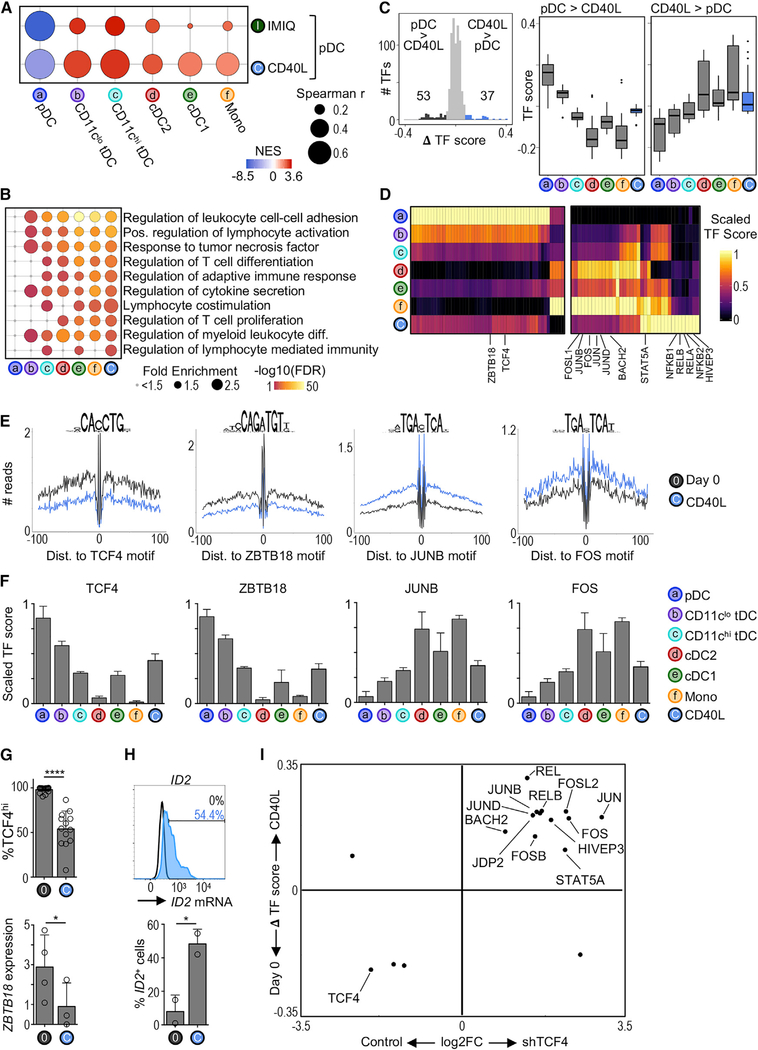
Figure 5. CD40L-Stimulated pDCs Share Chromatin Accessibility Landscape with tDCs and cDCs.
(A) Modified GSEA to test for enrichment of DC subset chromatin signatures among CD40L- or IMIQ-stimulated pDCs (see Quantification and Statistical Analysis). The bubble size represents the Spearman’s rank correlation coefficient. The color indicates the normalized enrichment score (NES).
(B) Top Gene Ontology terms enriched in CD40L-stimulated pDCs compared to freshly isolated (day 0) pDCs. The terms are colored and ranked by −log10 FDR. The bubble size represents the term fold enrichment.
(C) Left: histogram of difference in TF scores between CD40L-stimulated pDCs and day 0 pDCs. The significantly different TF motifs (ΔTF score > |0.08| and p-adj < 0.05) are colored. Right: boxplots of TF scores.
(D) Heatmap of differentially active TFs from (C). The color indicates the scaled TF score for each subset.
(E) HINT-ATAC footprint plots for indicated TFs. The data are pooled from 3–4 donors per condition.
(F) Bar graphs of scaled scores for select TFs from (D) (n = 4–17 samples per cell type).
(G) Top: frequency of pDCs expressing high levels of TCF4 protein measured by flow cytometry (n = 13–17 in 10–14 experiments). Bottom: ZBTB18 transcript variant 1 expression measured by RT-PCR (n = 3–4 in 3–4 experiments). The statistics are determined by t test.
(H) Top: representative histogram of ID2 mRNA expression in 2-day CD40L-stimulated pDCs measured by PrimeFlow. The unfilled histogram represents the control. Bottom: frequency of ID2+ pDCs (n = 2 in 2 experiments).
(I) Scatterplot comparing changes between CD40L stimulation and TCF4 silencing. x axis: FC of mRNA expression between TCF4 and control small hairpin RNA (shRNA) conditions in the pDC cell line CAL-1 (microarray) (Ceribelli et al., 2016). y axis: ΔTF score between freshly isolated (day 0) and CD40L-stimulated pDCs (ATAC-seq). Shown are TFs that were significantly different in both analyses.
Bar graphs show means ± SDs. *p < 0.05 and ****p < 0.0001. See also Figure S5.

