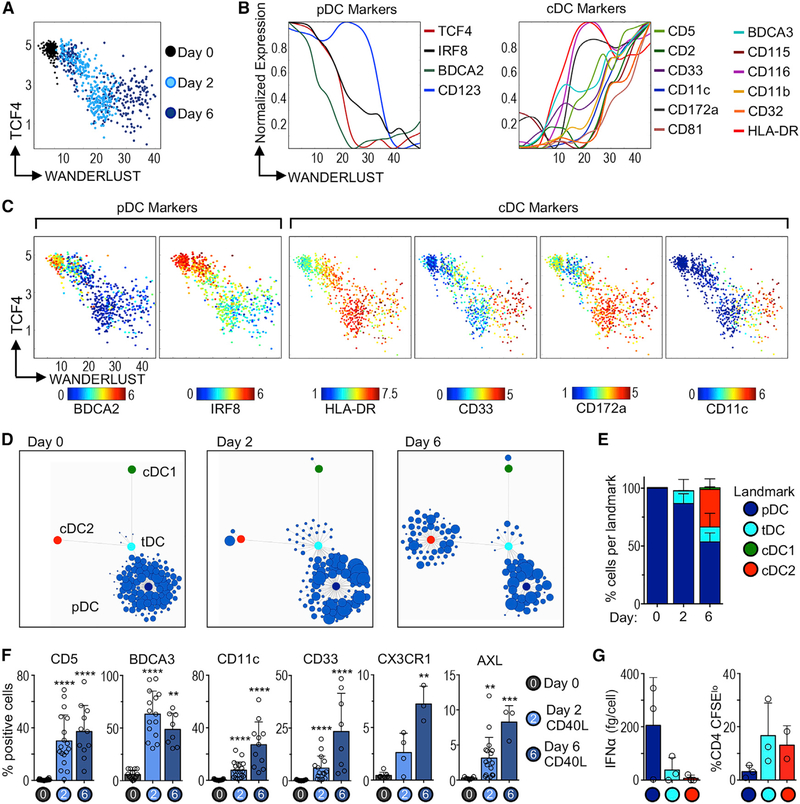
Figure 6. Single-Cell Trajectory of pDC Cell State Conversion during Stimulation.
(A) Wanderlust trajectory of fresh (day 0), 2-, or 6-day CD40L-stimulated bona fide pDCs analyzed by CyTOF; each point represents 1 cell (1 experiment of 3–4).
(B) Normalized expression of pDC and cDC markers plotted along Wanderlust trajectory axis.
(C) As in (A), but colored by expression of key markers.
(D) Statistical Scaffold maps of CyTOF data from fresh (day 0), 2-, or 6-day CD40L-stimulated pDCs (1 representative donor).
(E) Summary graph of frequency of pDCs mapped to each landmark node (n = 2–3 donors in 3–4 experiments).
(F) Protein expression in fresh (day 0), 2-, or 6-day CD40L-stimulated bona fide pDCs analyzed by flow cytometry and CyTOF (n = 3–18 donors in 3–16 experiments). Statistics determined by Kruskal-Wallis with Dunn’s multiple comparisons test.
(G) Functional analysis of pDCs that mapped to each landmark node. Two-day CD40L-stimulated pDCs were re-sorted based on phenotype. Left: IFN-α in culture supernatant after 24 h CpG-A, measured by ELISA. Right: T cell proliferation in MLR (n = 2–3 donors in 2–3 experiments).
Bar graphs show means ± SDs. **p < 0.01, ***p < 0.001, and ****p < 0.0001. See also Figure S6 and Table S2.

