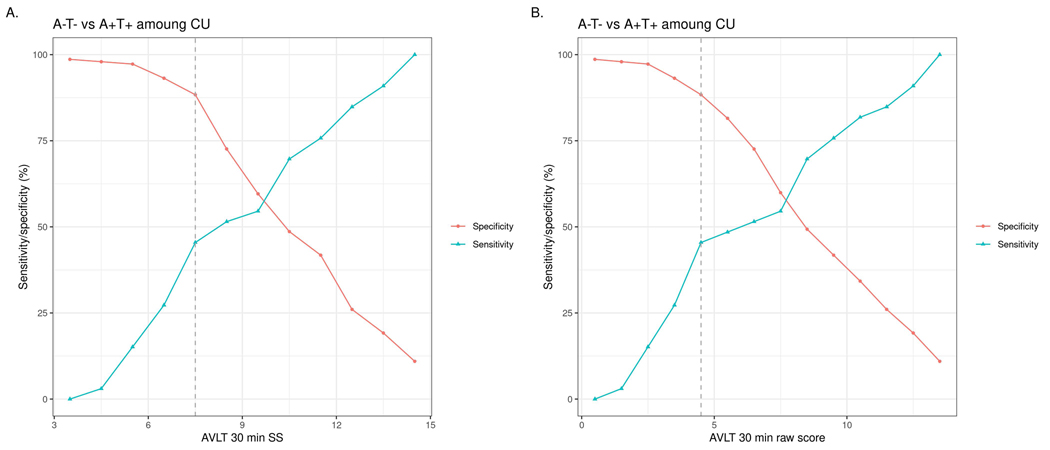
Figure 1.
AVLT 30 minute delayed recall sensitivity/specificity plot for differentiating CU A-T- and CU A+T+ groups. Panel A shows age-corrected scaled scores and panel B shows raw scores. The dotted line indicates the derived optimal cut-off per Youden’s index, which jointly maximizes the sum of sensitivity and specificity.

