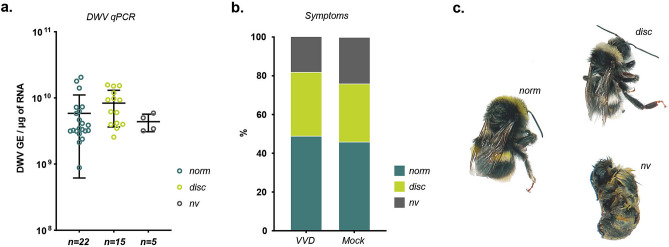
Figure 4.
Morbidity of DWV in bumble bees. (a) qPCR analysis of DWV level in developed bumble bees injected with 106 GE of VVD DWV at white-eyed (P0-P1) pupa stage. Individual values for each sample are shown with dots, lines represent mean ± SD, “GE” —genome equivalents. (b) Percentage of visually normal (“norm”), discolored (“disc”) and non-viable (“nv”) bumble bees developed from pupae in VVD DWV-injected (n = 43) and PBS-injected (“Mock”, n = 37) groups. (c) Phenotype of bumble bees developed from pupae in the incubator.

