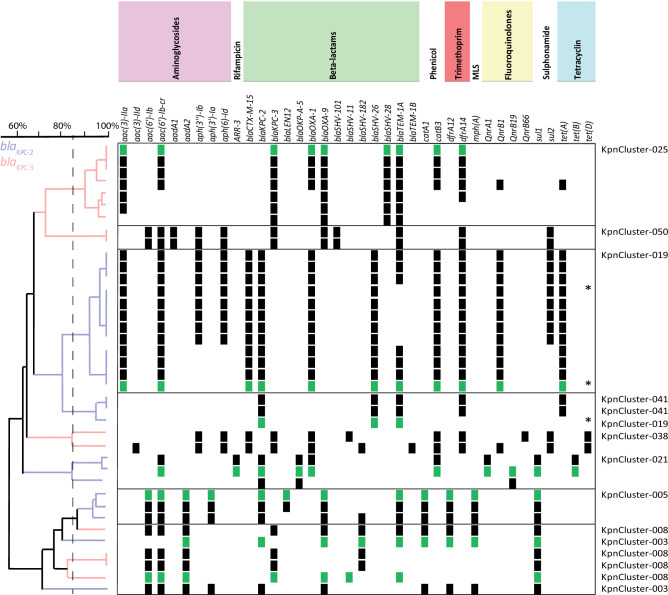
Figure 2.
Resistome of K. pneumoniae blaKPC-2 and blaKPC-3 cluster isolates. K. pneumoniae blaKPC-2 and blaKPC-3 cluster isolates were indicated on the y-axis and AMR genes on the x-axis. All isolates analysed contained the fosA, oqxA and oqxB AMR genes and were not included in this figure. The clustering was based on the presence (squares) and absence of AMR genes. Antibiotic classes are indicated above the AMR genes in different colors. Resistance genes in K. pneumoniae blaKPC-2 or blaKPC-3 cluster isolates that were sequenced with TGS were marked with green squares. Genetic relatedness was depicted in an UPGMA tree in which K. pneumoniae blaKPC-2 isolates were marked with blue branches, and K. pneumoniae blaKPC-3 were marked magenta. Dutch KpnCluster-019 isolates were marked with an *. A dotted line marks the 85% cut off.

