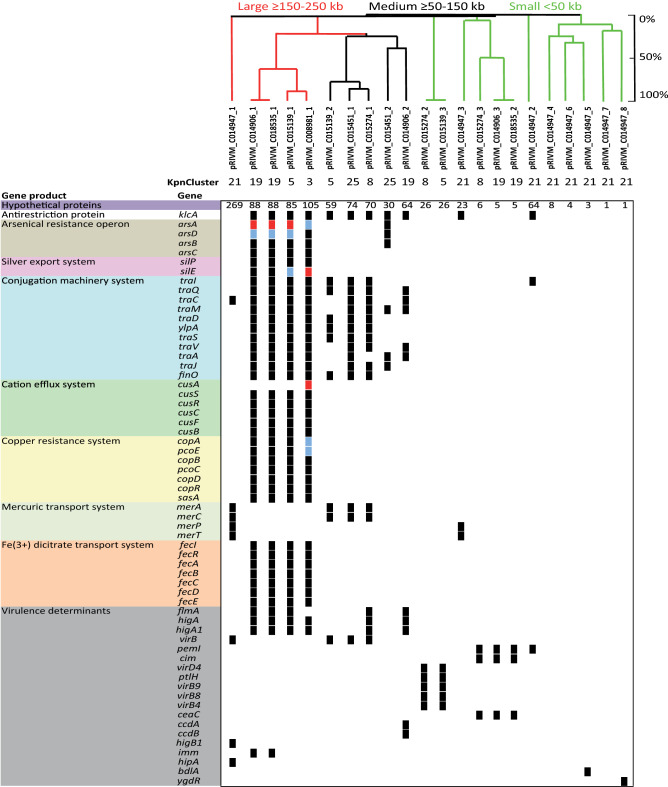
Figure 4.
K. pneumoniae plasmid gene content. An UPGMA clustering was performed based on the plasmid DNA sequence for the determination of the genetic relation among the 22 plasmids. Similarity is indicated on the y-axis using a scale from 0 (not similar) to 100% (identical). A similarity of ≥ 85 to 100% is regarded as the same plasmid. The plasmids are indicated on the x-axis. The presence (black squares) and absence is indicated of annotated genes among the 22 plasmids of seven TGS sequenced isolates. If a gene was present twice, blue squares were used and more than 2, red squares were used. Colors indicated different groups of genes with a specific function. In the UPGMA tree, large plasmids are indicated in red, medium plasmids in black and small plasmids in green color.

