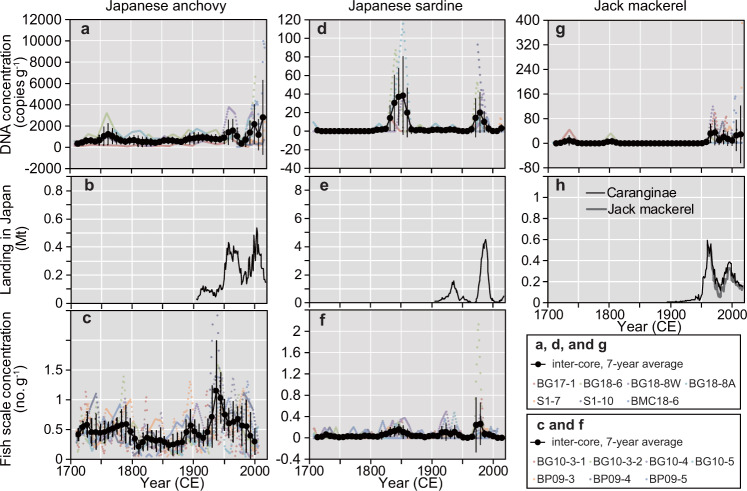
Fig. 4. Comparison between temporal changes in sedDNA concentrations, landings, and fish scales.
a, d, and g: inter-core, seven-year averaged concentrations of DNA for anchovy (left), sardine (middle), and jack mackerel (right). b, e, and h: total landings in Japan. c and f: fish scales. Of note, the landings of Caranginae (jack mackerel plus amberstripe scad, Decapterus muroadsi) consist mostly of those of jack mackerel. Error bar of each data point denotes 1 SD. Translucent colored plots denote annual data points for each core.

