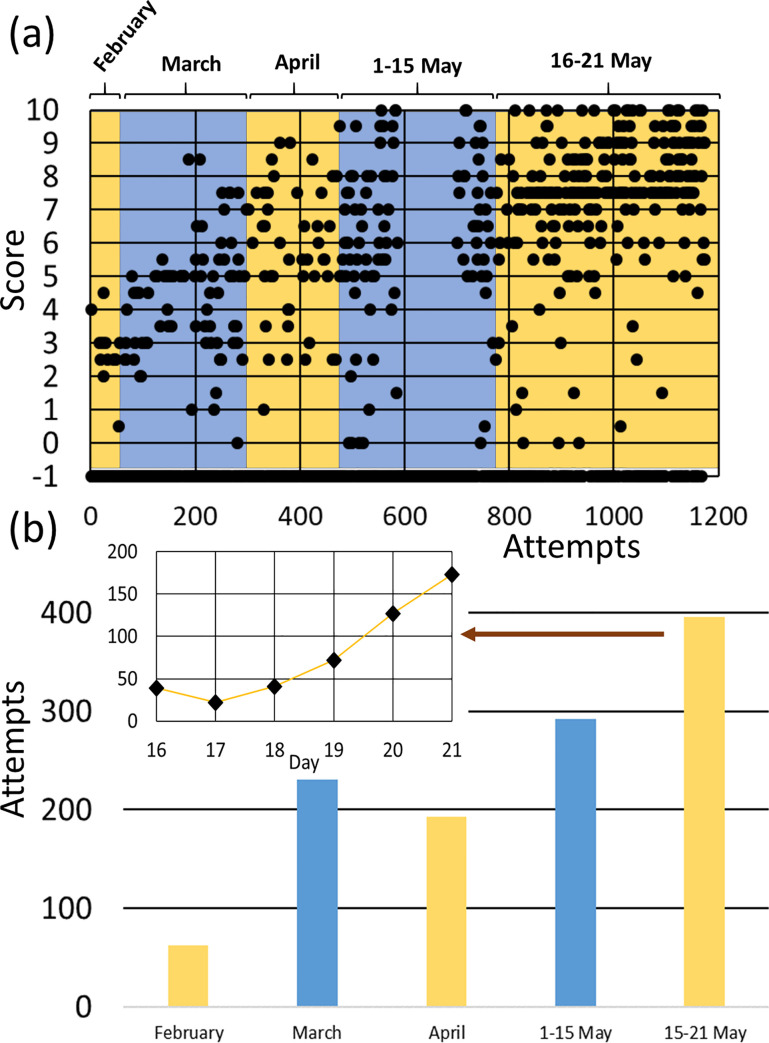
Fig 4. Distribution of self-evaluation activities in “Applied Computing”.
(a) Individual scores of all the students in the academic year 2017/2018 (ordered chronologically). Each dot corresponds to a single attempt of a student. (b) Number of attempts in the academic year 2017/2018 distributed in time periods. Inset shows the distribution in the days between May 16 and May 21.

