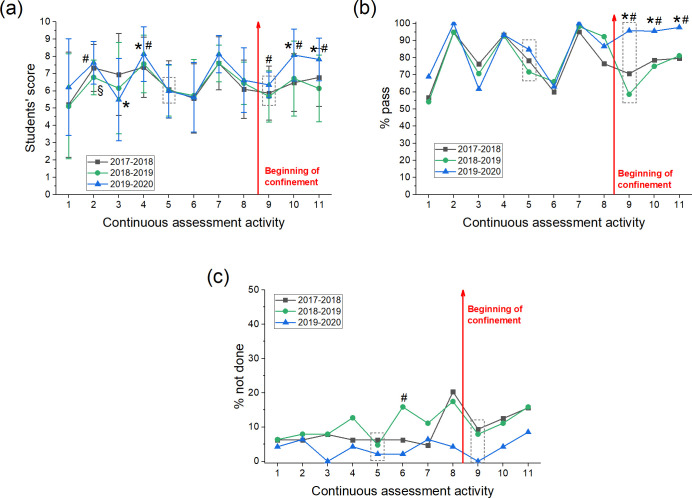
Fig 8. Results of students enrolled in Metabolism during the last 3 academic years.
(a) The score obtained by students in the different activities of the continuous assessment is represented. (b) Proportion of students that passed the continuous assessment activities (score≥5). (c) Proportion of students that did not carry out the continuous assessment activities. From the 11 activities, only 2 are in-person activities under normal conditions (number 5 and 9, highlighted with a box), the other activities were always on-line. The end of in-person teaching and beginning of confinement is indicated with a red arrow. Data is presented as mean±SD. Symbols indicate statistically significant differences (p<0.05) between courses 2017/2018 and 2018/2019 (§), 2017/2018 and 2019/2020 (*) and 2018/2019 and 2019/2020 (#).

