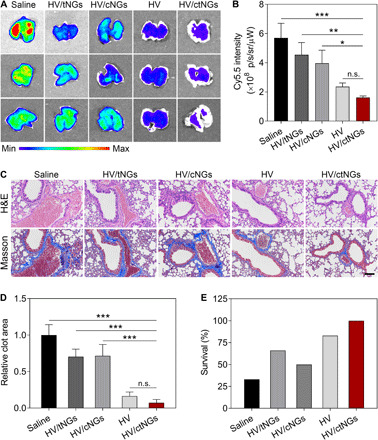
Fig. 4. In vivo therapeutic efficacy study on the thromboplastin-induced pulmonary embolism mouse model.

(A) Fluorescent images of the lung tissues harvested from the mice after different treatments at 15 min after induction. The pulmonary emboli were labeled with Cy5.5. (B) Fluorescent intensity of Cy5.5 in the lung tissues. Data are shown as means ± SD (n = 3). P > 0.05 (no significance, n.s.), *P < 0.05, **P < 0.01, and ***P < 0.001. (C) Representative H&E- and Masson’s trichrome–stained images of the lung sections after different treatments at 15 min after induction. Scale bar, 100 μm. (D) Relative clot areas in the lung tissues after different treatments at 15 min after induction. Data are shown as means ± SD (n = 3). P > 0.05 (no significance, n.s.) and ***P < 0.001. (E) Survival rates of the mice after different treatments within 2 hours (n = 6).
