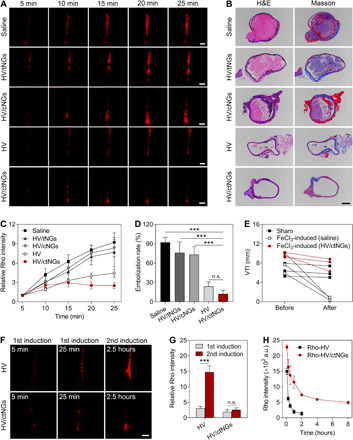
Fig. 5. In vivo therapeutic efficacy study on the FeCl3-induced carotid artery thrombosis mouse model.

(A) Representative fluorescent images of the carotid arteries of the mice after intravenous injection of different HV formulations for different time. The blood clots were labeled with Rho 6G. Scale bars, 500 μm. (B) Representative H&E- and Masson’s trichrome–stained images of the carotid arterial transverse sections after intravenous injection of different HV formulations for 25 min. Scale bar, 100 μm. (C) Changes in the relative fluorescent intensity of Rho after different HV formulations over time. Data are shown as means ± SD (n = 3). (D) Embolization rates in the H&E-stained carotid arterial transverse sections after different treatments. Data are shown as means ± SD (n = 3). P > 0.05 (no significance, n.s.) and ***P < 0.001. (E) VTI of the carotid arteries of the mice before and after intravenous injection of HV/ctNGs for 25 min. (F) Representative fluorescent images of the carotid arteries of the mice after intravenous injection of HV and HV/ctNGs for different time upon sequential induction. The blood clots were labeled with Rho 6G. Scale bar, 500 μm. (G) Relative fluorescent intensity ratios of Rho after intravenous injection of HV and HV/ctNGs upon sequential induction. Data are shown as means ± SD (n = 3). P > 0.05 (no significance, n.s.) and ***P < 0.001. (H) Pharmacokinetic profiles of Rho-HV and Rho-HV/ctNGs after intravenous injection into the rats. Data are shown as means ± SD (n = 3).
