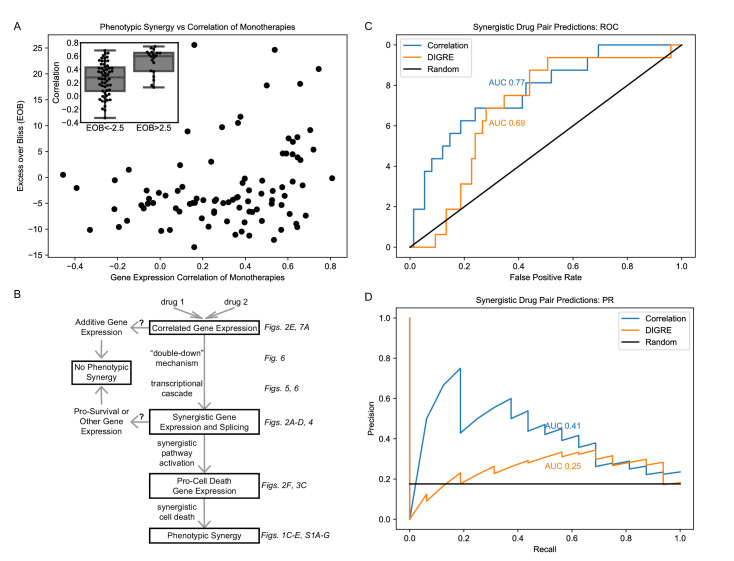
Figure 10. Correlation of monotherapies is associated with synergy in an independent dataset.
(A) Relationship between Excess Over Bliss (EOB) for 91 drug pairs and the correlation between the gene expression of LY3 DLBCL cells treated with corresponding monotherapies in the DREAM dataset. The inset indicates the distribution of correlations for pairs with EOB <−2.5 and EOB >2.5. (B) Hypothetical model for the relationships between monotherapy correlation, SEGs, and synergy. Boxed nodes represent phenomena we directly measured in this study. (C–D) ROC (C) and PR (D) for classification of synergistic drug pairs using expression correlation and DIGRE.

