. 2020 Sep 18;9:e52707. doi: 10.7554/eLife.52707

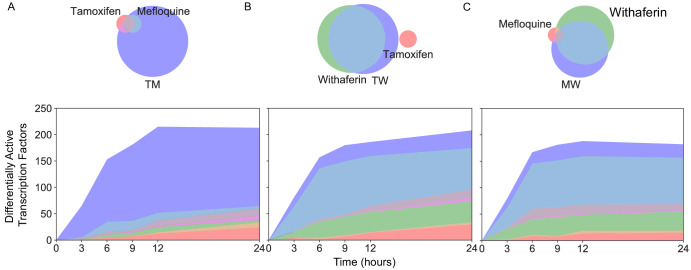
Figure 7. New differentially active transcription factors emerge in combination TM.

Number of DATFs over time with Venn diagrams at 3 hr in (A) T, M, and TM; (B) T, W, and TW; and (C) M, W, and MW in MCF7 cells. Area represented in each color matches the number of genes in the corresponding color of the Venn diagram; blue areas represent synergistic TFs. (See also Source data 9).

Figure 7.

Figure 7—figure supplement 1. Possible changes to transcription factor activity.
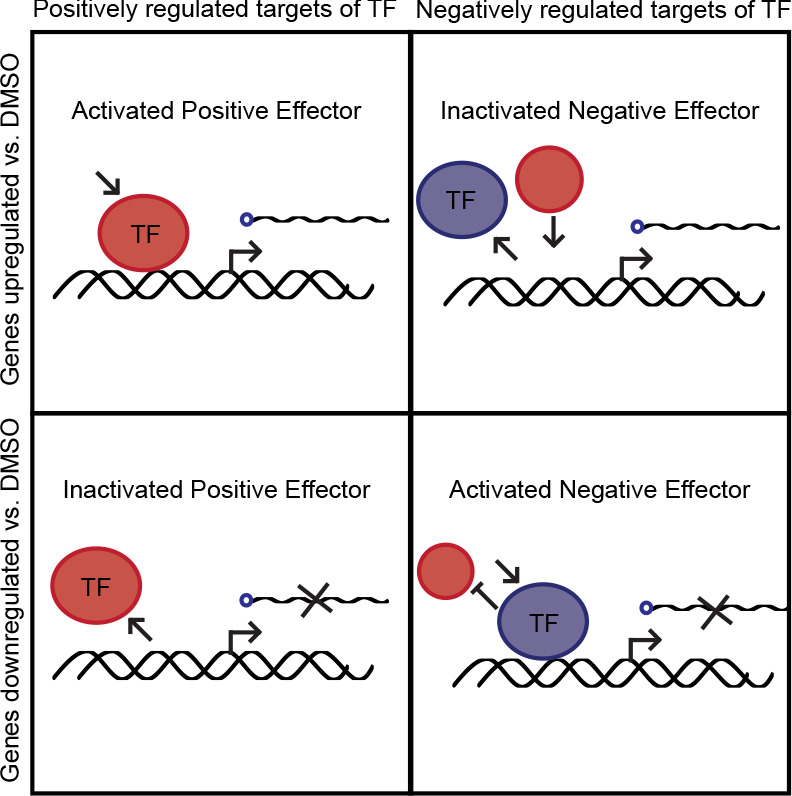
Figure 7—figure supplement 1.

Four cases of transcription factor activity that were assessed to determine whether a transcription factor was activated or inactivated.
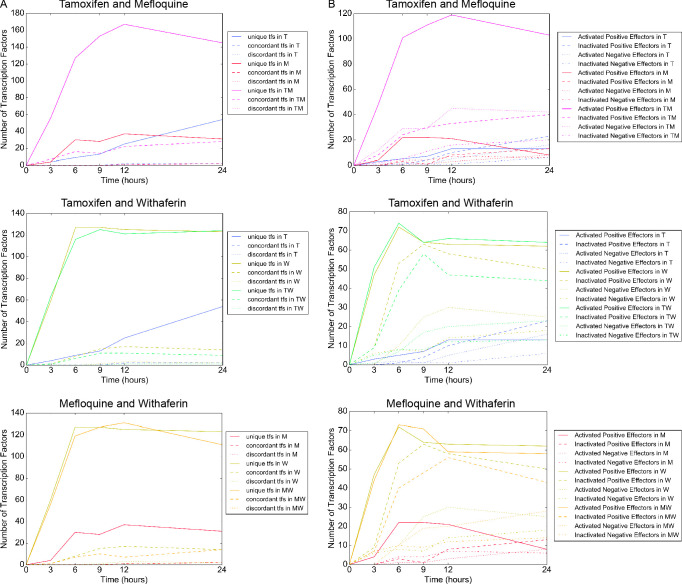
Figure 7—figure supplement 2. Classes of differentially active transcription factors in MCF7 cells.

Figure 7—figure supplement 2.

(A) Differentially active transcription factors for each combination according to the status of the positive and negative effector of each transcription factor. Unique: either positive or negative effector, but not both, is differentially active; concordant: both effectors are activated or both are inactivated; discordant: one effector is activated and the other is inactivated. (B) Differentially active transcription factors for each combination according to each of the four cases supplement 1.