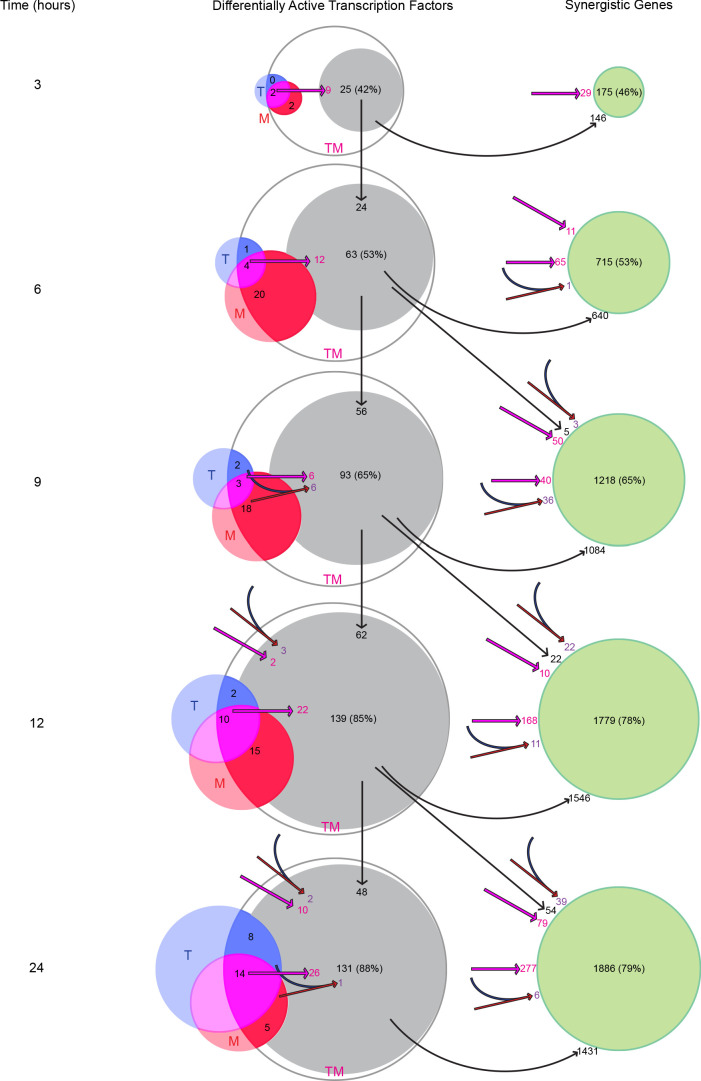
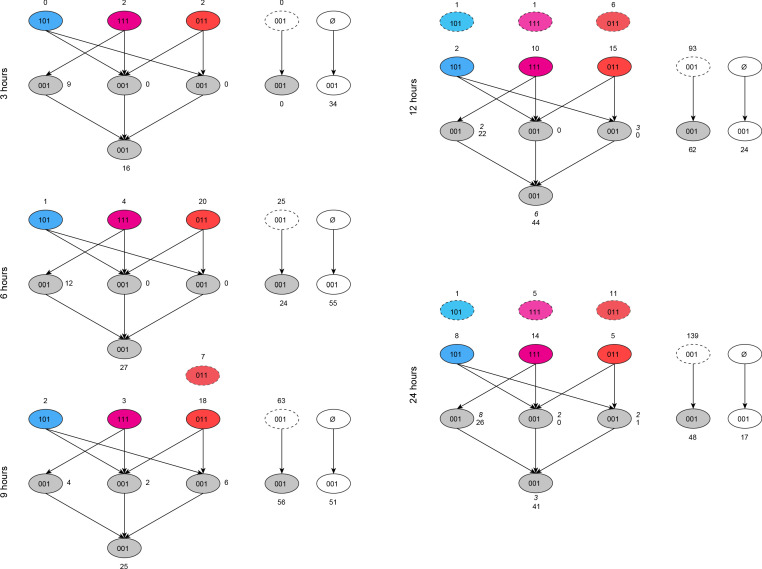
Connections between differentially active transcription factors in TM based on the MCF7 network. Each bubble represents a set of transcription factors that are differentially active in TM at a given timepoint. The codes on each bubble represent their differential activity status in Tamoxifen (first digit), Mefloquine, (second digit), and TM (third digit), where one is differentially active and 0 is not. Synergistic transcription factors in TM (001), are categorized into ‘explained’ bubbles (gray) or not explained (white). At each timepoint, synergistic transcription factors can be ‘explained’ by a network connection to a transcription factor that is differentially active in Tamoxifen and Mefloquine (111, magenta), or to at least one transcription factor in each of Tamoxifen alone (101, blue) and Mefloquine alone (011, red), or both, resulting in the left-hand, right-hand, and middle gray bubbles, respectively, in the middle layer. The fourth gray bubble in the lowest layer represents transcription factors which have connections to transcription factors in the middle ‘explained’ layer, but not to transcription factors in the top layer. Numbers in italics represent synergistic transcription factors that can be explained by connections to transcription factors that were active in monotherapies at the previous time point (blue, magenta, and red bubbled with dashed outlines at top of each timepoint). At the right in each time point, the dashed-outline bubble represents ‘explained’ transcription factors in the gray bubbles at the previous time point. Synergistic transcription factors not explained by other means which have a connection to any ‘explained’ transcription factors at the previous time point are shown in the gray bubble below the dashed-outline bubble. Finally, synergistic transcription factors that cannot be explained by any network connections are shown in the white bubble resulting from the ‘null’ set at each timepoint. The colors in this figure correspond to
Figure 9, and the sum of all gray bubbles at each timepoint in this figure correspond to the single gray bubble shown at each timepoint in
Figure 9. (See also
Source data 10).


