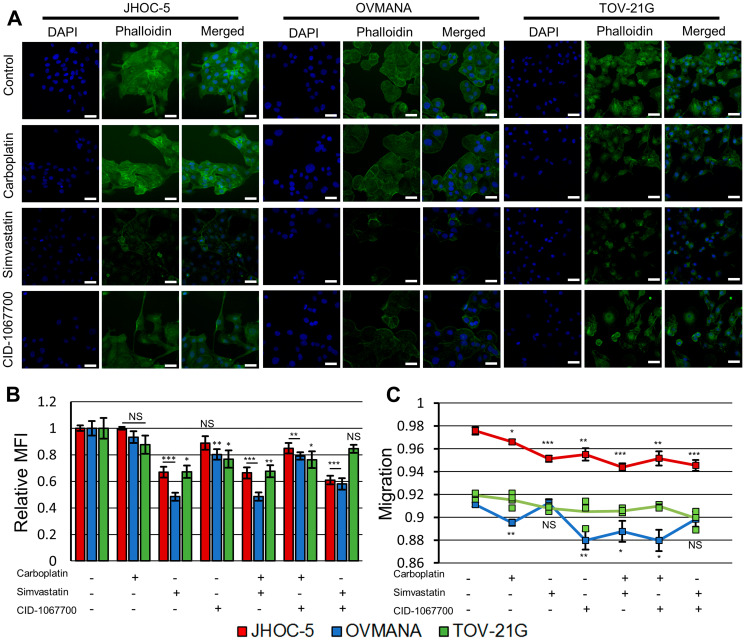
Figure 2. Effect of treatments upon cytoskeletal integrity and migration in JHOC-5, OVMANA and TOV-21G cell lines.
(A) Representative fluorescence images of JHOC-5, OVMANA and TOV-21G. Individual channels for phalloidin and DAPI were background corrected against the corresponding channel in the respective cell line DMSO control. White scalebar is 50 μm. (B) Relative mean fluorescence intensity (MFI) of fluorescently labeled F-actin for JHOC-5 (Red), OVMANA (Blue) and TOV-21G (Green). MFI is shown relative to untreated controls. Results are from two experiments in quadruplicates. Error bars are SEM (N = 8). All comparisons are against untreated corresponding cell line controls. (C) Migration for JHOC-5 (Red), OVMANA (Yellow) and TOV-21G (Green). Results are from two experiments in quadruplicate (JHOC-5, OVMANA), or one experiment in quadruplicate (TOV-21G) (N = 8 for JHOC-5 and OVMANA. N = 4 for TOV-21G). Error bars are SEM. All comparisons are against untreated corresponding cell line controls. No comparisons were performed for TOV-21G. * p < 0.05, ** p < 0.01, *** p < 0.001.

