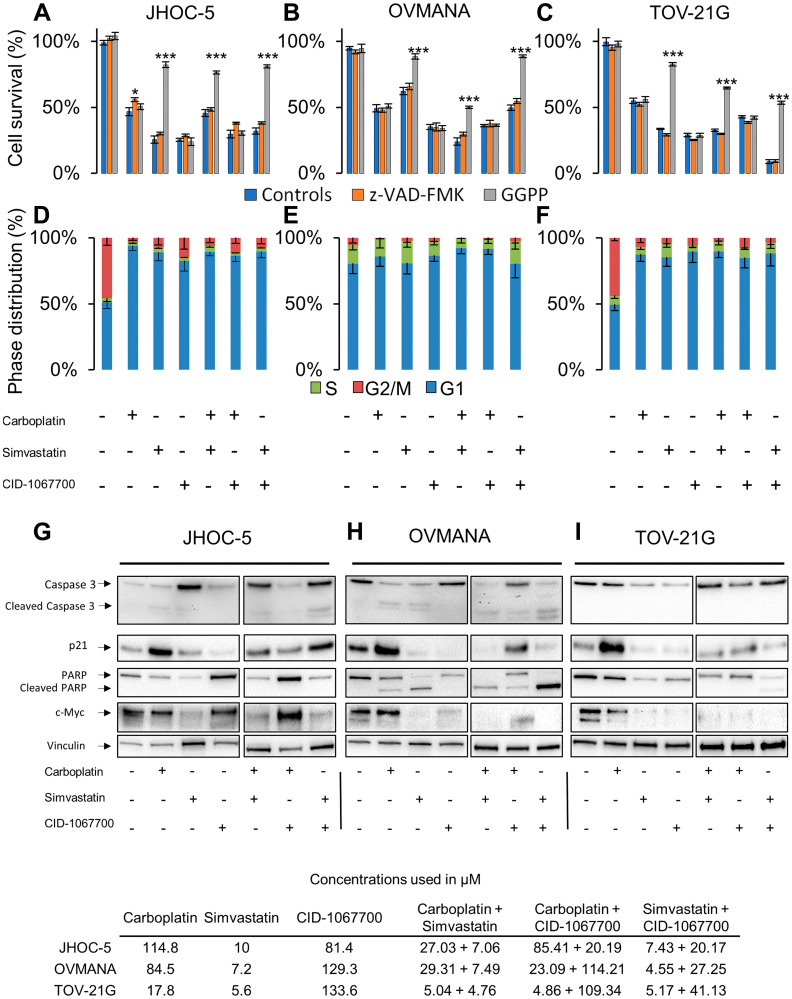
Figure 3. Cellular response to single agent or combination treatments in JHOC-5, OVMANA and TOV-21G cells.
Top panel: Cell survival in response to co-treatment with controls (Blue), Z-VAD-FMK (Orange), or GGPP (Grey) in (A) JHOC-5: (B) OVMANA; (C) TOV-21G. Error bars are SEM and results are from at least 3 experiments in triplicate (N > 9). Comparisons are made against treated controls. * p < 0.05, ** p < 0.01, *** p < 0.001. Mid panel: Cell cycle phase distribution in response to treatment for (D) JHOC-5; (E) OVMANA; (F) TOV-21G. Error bars are SD and results are from three independent experiment each with 10,000 cells (N = 3). Bottom panel: Immunoblot analysis of single agent treatment in (G) JHOC-5; (H) OVMANA; (I) TOV-21G. Immunoblots were done at least three times for consistency. Concentrations used in the experiments are listed in the table at the bottom.

