Figure 4.

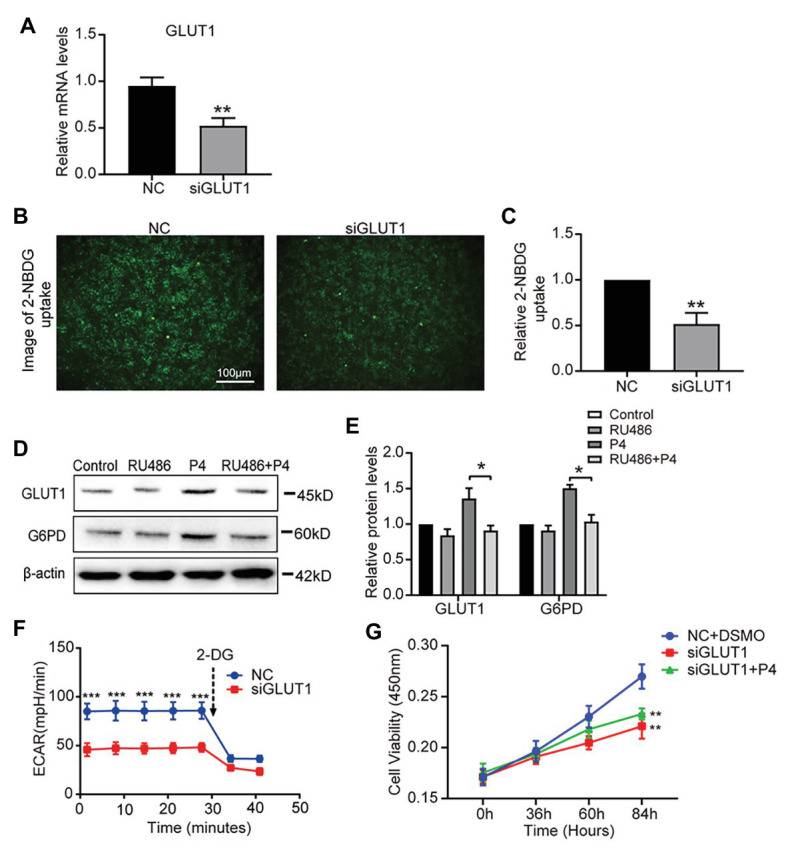
The down-regulation of GLUT1 inhibits glycolysis and proliferation. (A) The qPCR analysis of GLUT1 mRNA levels in RL95-2 cells treated with negative control (NC) small interfering RNA (siRNA) or GLUT1 siRNA (n = 3, normalized by β-actin). (B) Fluorescent image of 2-NBDG uptake into cells treated with NC siRNA or GLUT1 siRNA (scale bar = 100 μm) (C) The relative 2-NBDG uptake ratio was analyzed by Image-Pro Plus software. (D) Western blot analysis of GLUT1 and G6PD in RL95-2 cells treated with control, P4 (10 nM), RU486 (10 μM), and P4 + RU486. The cells were pretreated with RU486 for 1 h before the P4 treatment. (E) Relative density analysis of the GLUT1 and G6PD proteins by Image Lab 4.0 software (n = 3). (F) The ECAR (mpH/min) was measured under basal conditions in RL95-2 cells treated with NC siRNA or GLUT1 siRNA (n = 3). (G) Cell proliferation assays of RL95-2 cells treated with NC + DSMO, siGLUT1, and siGLUT1 + P4 (100 nM) by CCK-8; n = 3, * vs. NC + DSMO. Error bars represent the mean ± SD. Student’s t-test, * p < 0.05, ** p < 0.01, *** p < 0.001.
