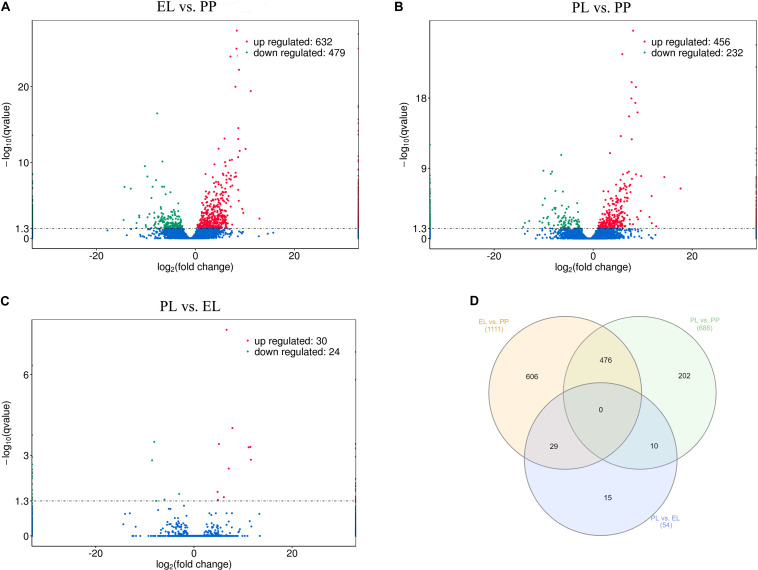
FIGURE 3.
Differentially expressed (DE) lncRNAs. (A) Volcano plot of differentially expressed lncRNAs in early lactation (EL) vs perinatal period (PP), where red and green represent upregulation or downregulation, respectively, same below. (B) Volcano plot of DE lncRNAs in peak lactation (PL) vs PP. (C) Volcano plot of DE lncRNAs in PL vs EL. (D) Venn diagram of DE lncRNAs, where orange, green, and blue represent EL vs PP, PL vs PP, and PL vs EL, respectively.

