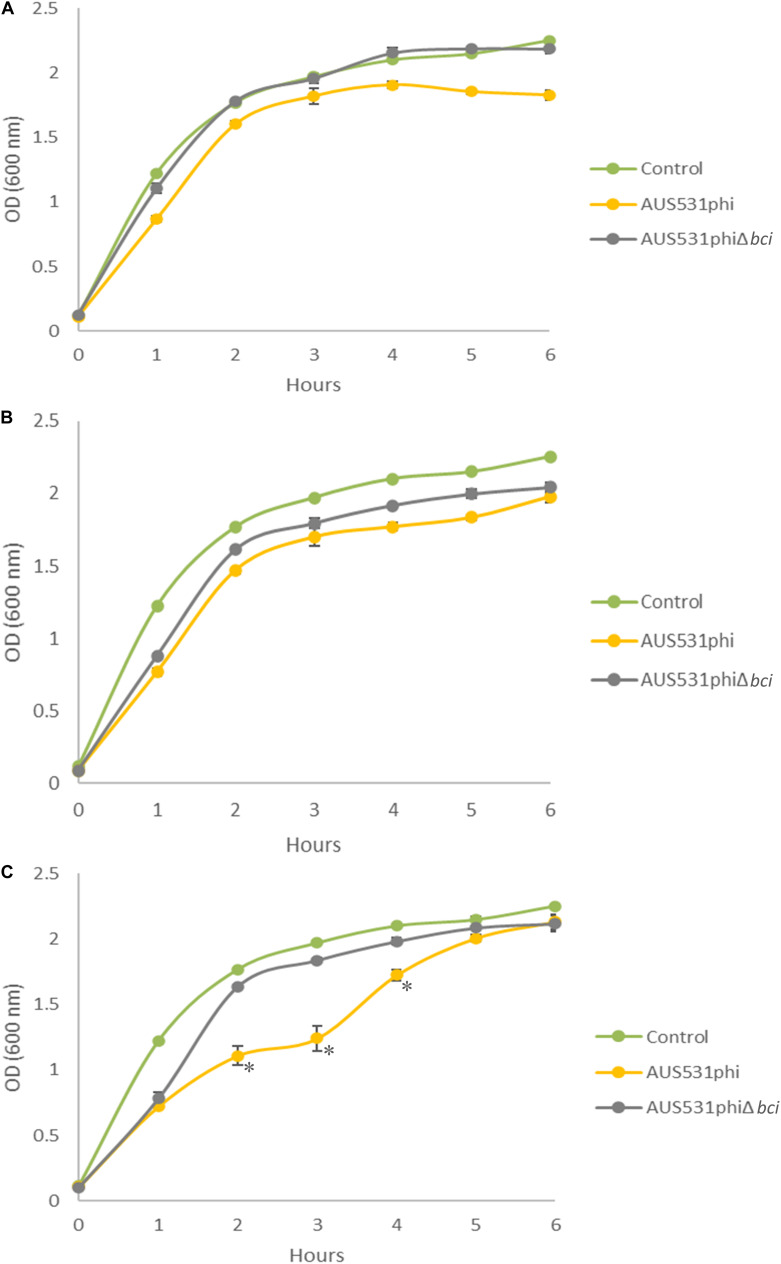
FIGURE 5.
Infection curves for the lysogenic phages AUS531phi (A) and AUS531phiΔbci at MOIs 0.1 (A), 1 (B), and 10 (C) during 6 h. Standard deviations are indicated. Statistically significant differences were determined by Student’s t-test for each point on the curve (GraphPad Prism v.6). (*) indicates a strongly significant difference (p < 0.0001).

