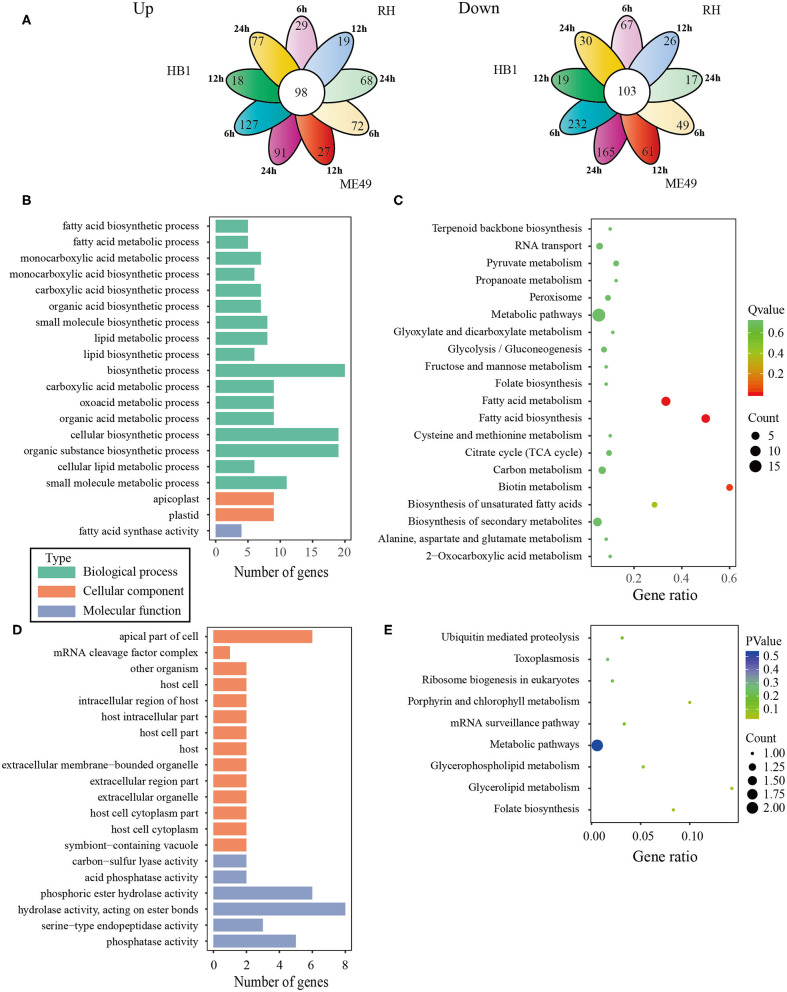
Figure 5.
The analysis of differentially co-expressed T. gondii genes among three strains at three time points; (A) The flower plot of differentially co-expressed T. gondii genes; (B) The GO term histogram of co-upregulated T. gondii genes; (C) The KEGG pathway bubble chart of co-upregulated T. gondii genes; (D) The GO term histogram of co-down regulated T. gondii genes; (E) The KEGG pathway bubble chart of co-down regulated T. gondii genes.

