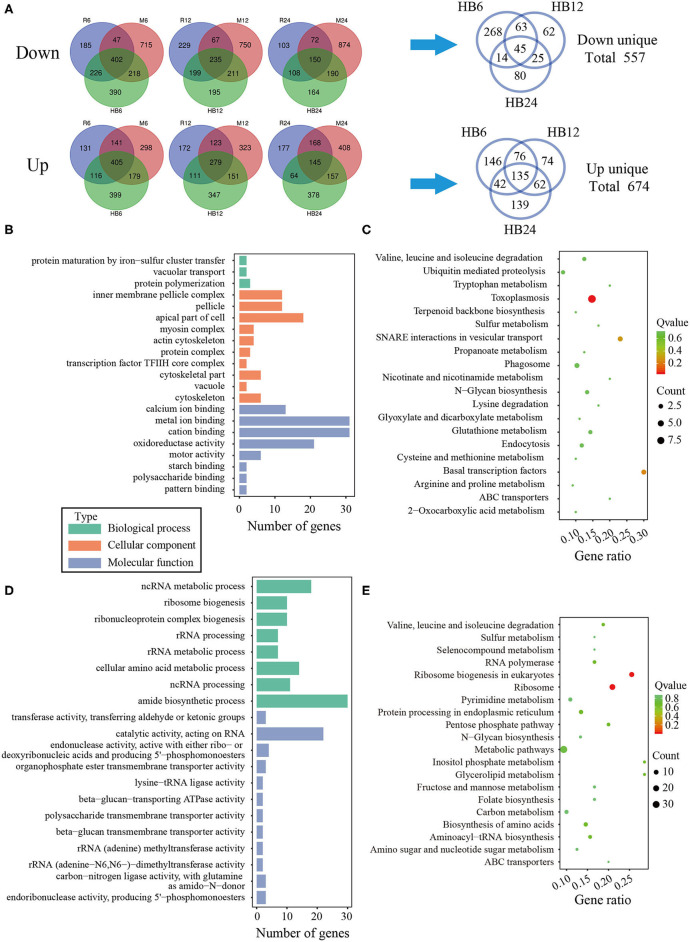
Figure 6.
The analysis of unique differentially expressed T. gondii genes by the TgHB1 infection group at least at one time point. (A) Venn diagram of unique up- and down-regulated differentially expressed T. gondii genes by the TgHB1 infection group at least at one time point; (B,C) The GO term histogram and KEGG pathway bubble chart of unique down-regulated differentially expressed T. gondii genes by the TgHB1 infection group; (D,E) The GO term histogram and KEGG pathway bubble chart of unique up-regulated differentially expressed T. gondii genes by the TgHB1 infection group. NC represented the control group. R6-24, H6-24, and M6-24 represented the experiment group of pig macrophage infected by RH, HB1, and ME49 strains at 6, 12, and 24 h, respectively.

