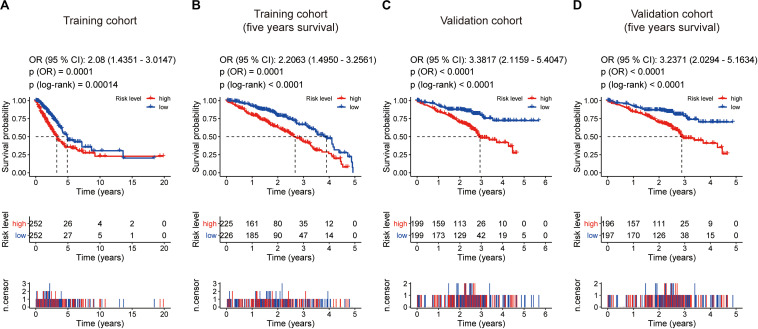
FIGURE 4.
Kaplan–Meier survival analyses based on the eight-gene signature. (A) Training cohort based on overall survival. (B) training cohort based on 5-year overall survival. (C) Validation cohort based on overall survival. (D) Validation cohort based on 5-year overall survival. The differences between the two curves were determined by the two-side log-rank test with a p value < 0.05. The odds ratio (OR) and its 95% confidence interval (95% CI) were calculated accordingly. The number of patients at risk is listed in the middle of each plot.

